When creating evaluations at the request of a funder, it can be easy to forget that there is also the opportunity to customise surveys using additional questions. You can maximise your use of the Impact & Insight Toolkit by adding your own questions, enabling you to generate further insight to support your organisation’s development. Culture Counts contains a Question Bank in the ‘Design’ tab of a survey. In here is the category titled ‘Experience’, which contains two questions:
- Net Promoter Score (NPS)
- Overall Experience
There are two key reasons we think they’re a great addition to your surveys:
- Responses to these questions provide a quick and easy-to-understand snapshot of your audience’s/participants’ experiences. The accessible nature of these responses makes them straightforward to share and discuss at internal meetings.
- Responses to these questions can be used for cross analysis purposes. In a nutshell, this means that you can use the responses to Experience questions as a proxy by which you can dig into your other responses. For instance, you might find that people that say they had a ‘poor’ overall experience, also give a noticeably lower score for the Personal Relevance dimension – ‘It felt relevant to me’ – than other respondents. A takeaway from this might be that the feeling of a personal connection to the type of work you offer is vital to establishing an overall positive experience. Therefore, this might be something you want to consider as you look at future programming, curating and marketing.
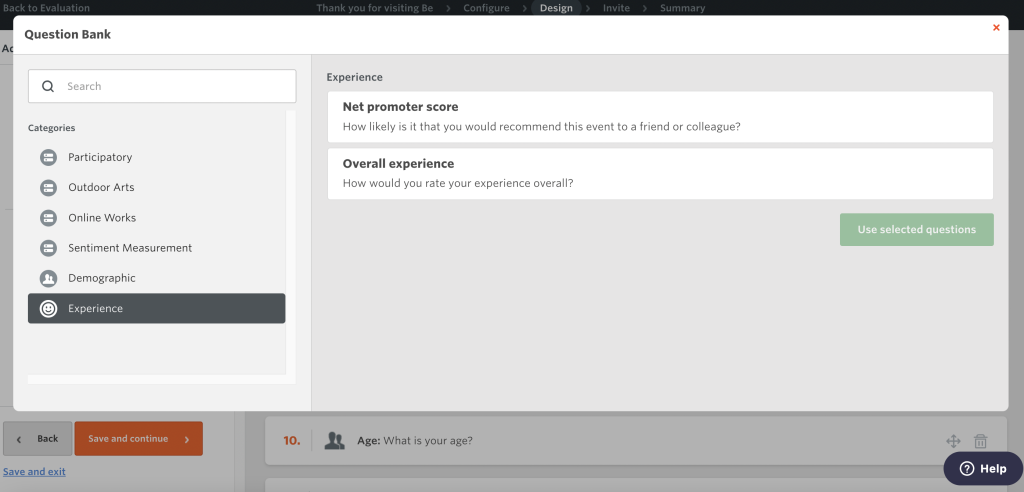
Net Promoter Score (NPS)
NPS is a globally recognised metric for measuring the likelihood of customers recommending an event, organisation or product. Adding an NPS question to your surveys can help you to determine the extent to which your customers’ experiences will impact the growth and development of your customer base. It is based on the concept that, in relation to your offering, respondents are one of the below:
- Promoters
- Passives
- Detractors
To make the NPS question widely applicable, the standard wording of the question is customisable in Culture Counts. This allows you to specify whatever it is you’re evaluating whilst reaping the benefits of using a standardised question: more accurate and comprehensive automated reporting. For instance: How likely is it that you would recommend ORGANISATION X to a friend or colleague? How likely is it that you would recommend VENUE Y to a friend or colleague? How likely is it that you would recommend EVENT Z to a friend or colleague? The respondent selects a number from 0 to 10 to indicate the likeliness of a recommendation and Culture Counts will calculate the NPS for you.
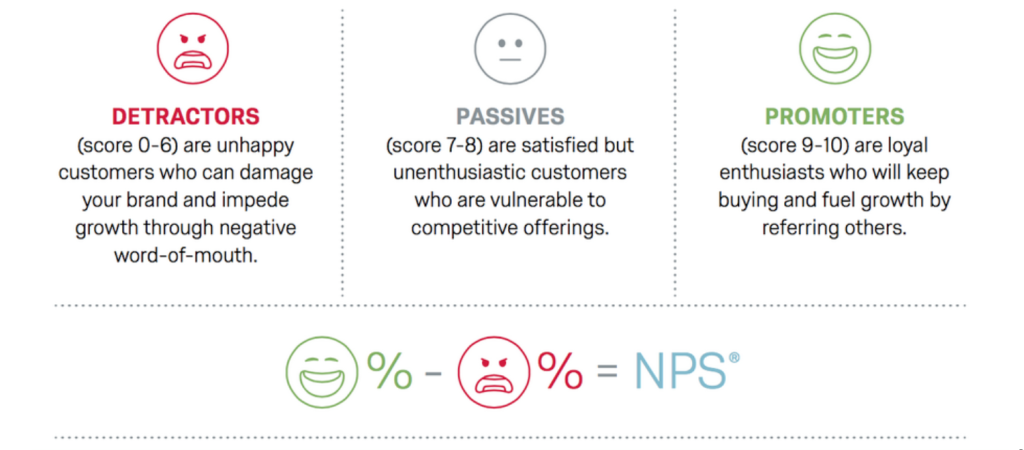
Image credit: Qualtrics
When using the inbuilt NPS question, the platform will present you with your NPS: a score between -100 and 100. In a nutshell, the higher the NPS, the more likely it is that your customers will recommend the subject of the question to a friend or colleague. In order to learn more about the use of NPS and how it is calculated, you may find Qualtrics’ article ‘What is NPS? Your ultimate guide to Net Promoter Score‘ useful.
Overall Experience
The Overall Experience question, How would you rate your experience overall?, is presented as a dropdown, with the options:
- Excellent
- Good
- Neutral
- Poor
- Terrible
Overall experience questions are very commonly used for evaluation purposes. There is a clear benefit in understanding whether customers had a positive experience or not. Also, when positioned near the beginning of a survey, it gives respondents the opportunity to express their overarching reaction to their experience, before you ask them to focus on specific aspects through the use of dimensions. The question has been standardised in order to support easy presentation of the output of the overall experience data in the Analytics Dashboard, as well as saving time in the process of survey creation.

Image credit: Formilla
Responses to the inbuilt Overall Experience question will be presented in your Analytics Dashboard as a bar chart, where you can see the percentage of respondents that selected each of the different options. This graph will provide you an overall snapshot of how your customers rated their experience.
Closing Words
These Experience questions have been included in your dashboards to provide you with the opportunity to gather more insight from your evaluations and to ultimately support your organisation in its development.
Include them in your evaluations and let us know how you get on.
Main image: Culture Counts