Does the survey delivery method affect results to dimension questions?
Introduction
The Impact & Insight Toolkit (Toolkit) approach to evaluation supports 4 delivery methods:
- Online (designed to be used where an organisation has access to email addresses)
- Interview (for one-to-one interviews onsite)
- Display (designed to be completed autonomously onsite)
- Paper (to be used when none of the other options are suitable as it is resource-heavy for the user)
As one can imagine, there are many reasons that an organisation may choose to use one method over another, or they might use a combination of the 4 methods[1].
One question that we have been asked by our users is whether the different delivery methods result in different responses to dimension questions asked in surveys. For instance, one might think that in a one-to-one interview, the interviewee would give more positive responses, due to a combination of interviewer bias and the interviewee not wanting to cause upset.
Several years ago, our partners at Culture Counts conducted some work on this[2], but we felt that an updated analysis could be beneficial, to support decision-making and results interpretation.
Summary of Findings
Our analysis concluded that results to dimension questions are not affected by the delivery method utilised in any meaningful way. In practical terms, this means that comparing results across surveys utilising different survey delivery methods is reasonable. It also indicates that you should select which survey delivery method works best for you practically, rather than concerning yourself with which method may yield higher results.
The remainder of this post talks about our approach to analysing the data and how we arrived at this result. So, if you are interested in the detail, please read on!
The data
This investigation considers the data collected for dimension questions, collected by users of the Toolkit from the 2023-24 financial year. In total, there are over 700,000 responses to dimension questions from this period.
Delivery methods usage
When looking at the quantity of use, online was the most frequently used delivery method. Where an evaluation used a combination of delivery methods, it was still very likely that the online delivery method would be one of those used.
This was not at all a surprise, as it is generally simpler to send online surveys via email for completion than it is to organise interviewers or make tablet computers available for use.
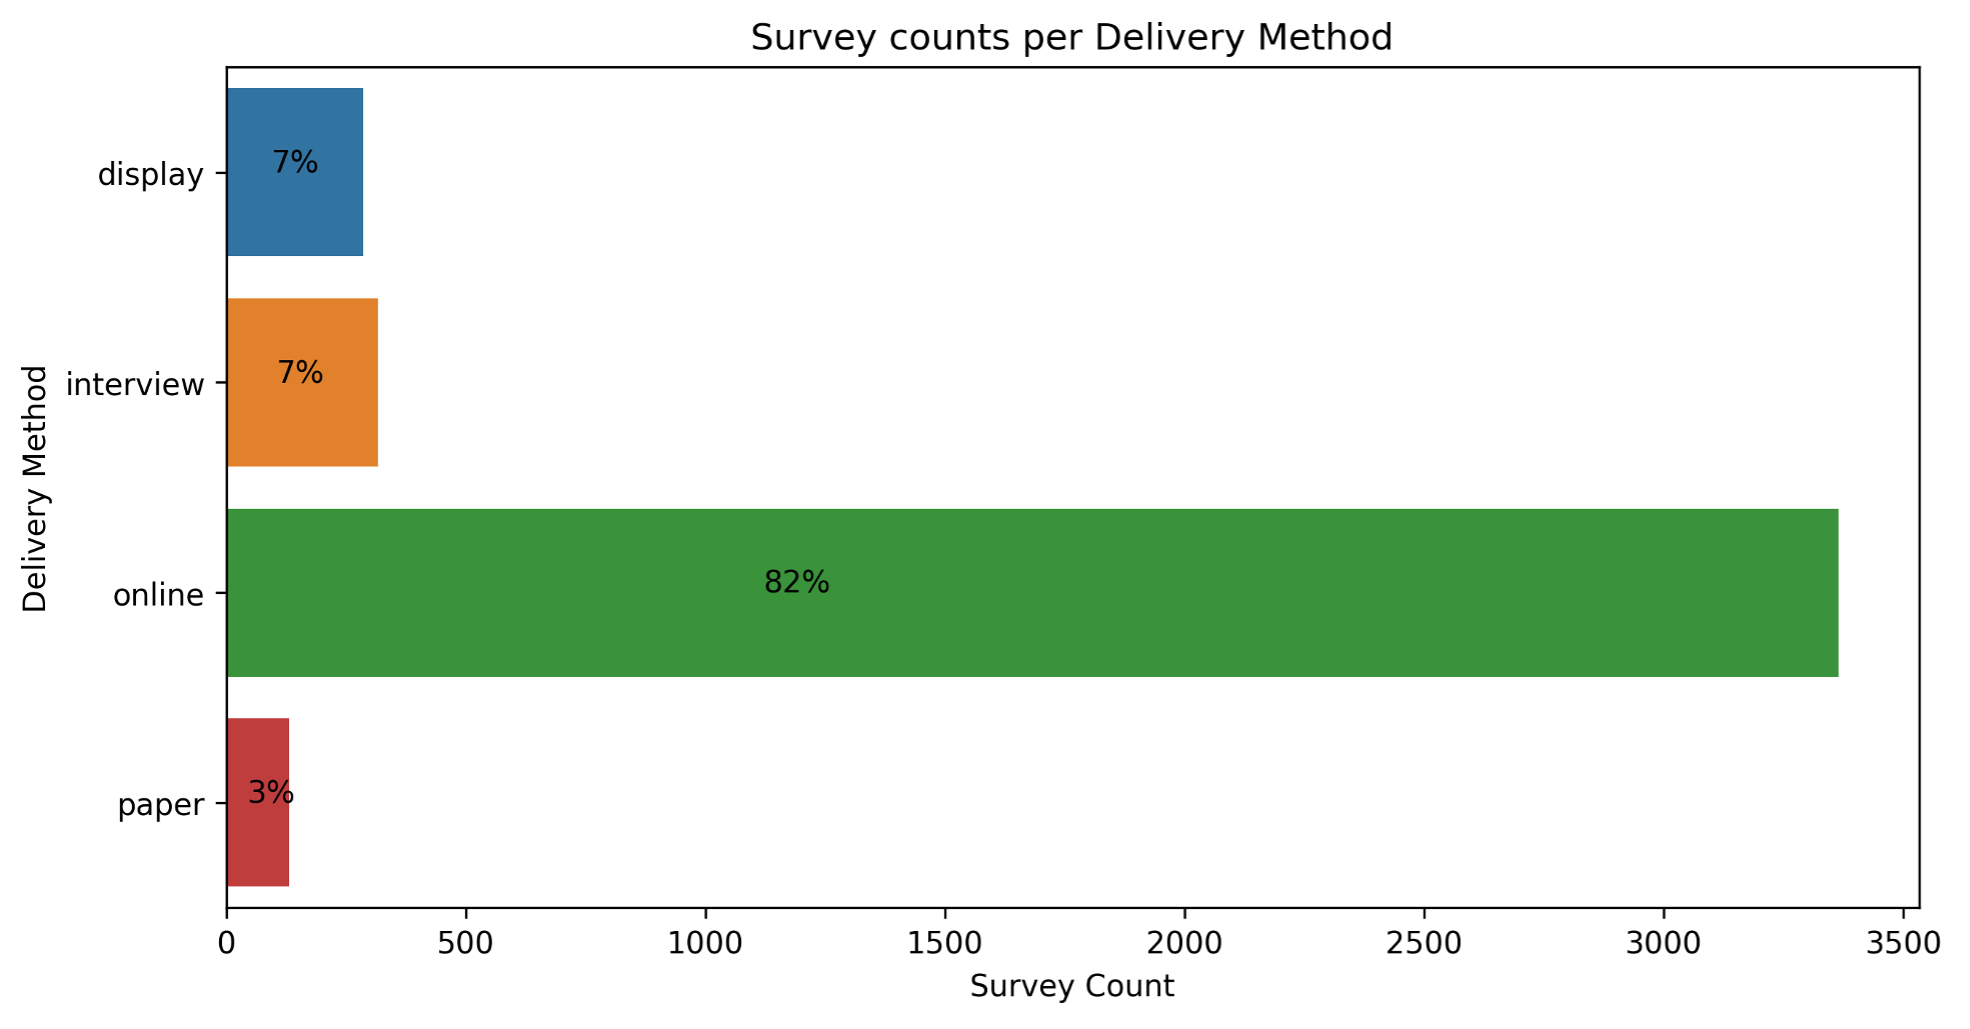 Figure 1 – Bar chart displaying the prevalence of each delivery method amongst surveys. The percentage value indicates the proportion of all surveys.
Methodology
When analysing the data, we accounted for various factors that may vary between delivery methods, such as: time elapsed since the experience, the length of the survey being completed, and the number of responses for an individual survey. This last one is important as we don’t want a single very large survey to skew our overall results. By doing so, we could isolate the differences caused by the delivery method and enabled a fair test.
Using Bayesian statistical testing, we calculated the range of possible differences between pairs of delivery methods. These ranges are referred to as credible intervals, and they tell us whether the differences likely exist and how big they are.
Results
Our analysis consistently indicated that there was a detectable difference in dimension results between the different delivery methods, and paper and online delivery methods.
However, as dimensions are rated on a 101-point scale, from 0-1, to two decimal places, 0.01 is the smallest value by which a dimension score can change, and anything below that threshold wouldn’t register.
So, our next step was to consider the size of the expected differences and compare them to the 0.01 threshold. If the differences were smaller than 0.01, then they would not register.
The following dimensions were found to have the largest expected difference in results between online and paper surveys:
| Celebration | It celebrated my own cultural heritage |
| Independence | It improved my financial situation |
| Visual Impact | It drew me in and made me look |
| Escapism | I was so immersed that I lost sense of time |
| Awareness | It opened my eyes to issues in the environment |
| Community Pride | It made me feel proud of my community |
| Decision Making | It enabled me to get involved in community decision-making |
| Accessibility | I find it easy to get to and from here |
| Destination | There are activities here that I’m willing to travel for |
| Local Understanding | It helped me to better understand the place and people where I live |
When we looked at the differences for these dimensions, as shown in the chart below, we found that Celebration was the only dimension which could potentially see a difference in results which exceeds the minimum threshold of 0.01.
Since the difference between paper and online was larger than comparisons of other delivery methods, and Celebration was the dimension for which that difference was the largest, we concluded that the differences between other delivery methods also did not exceed 0.01.
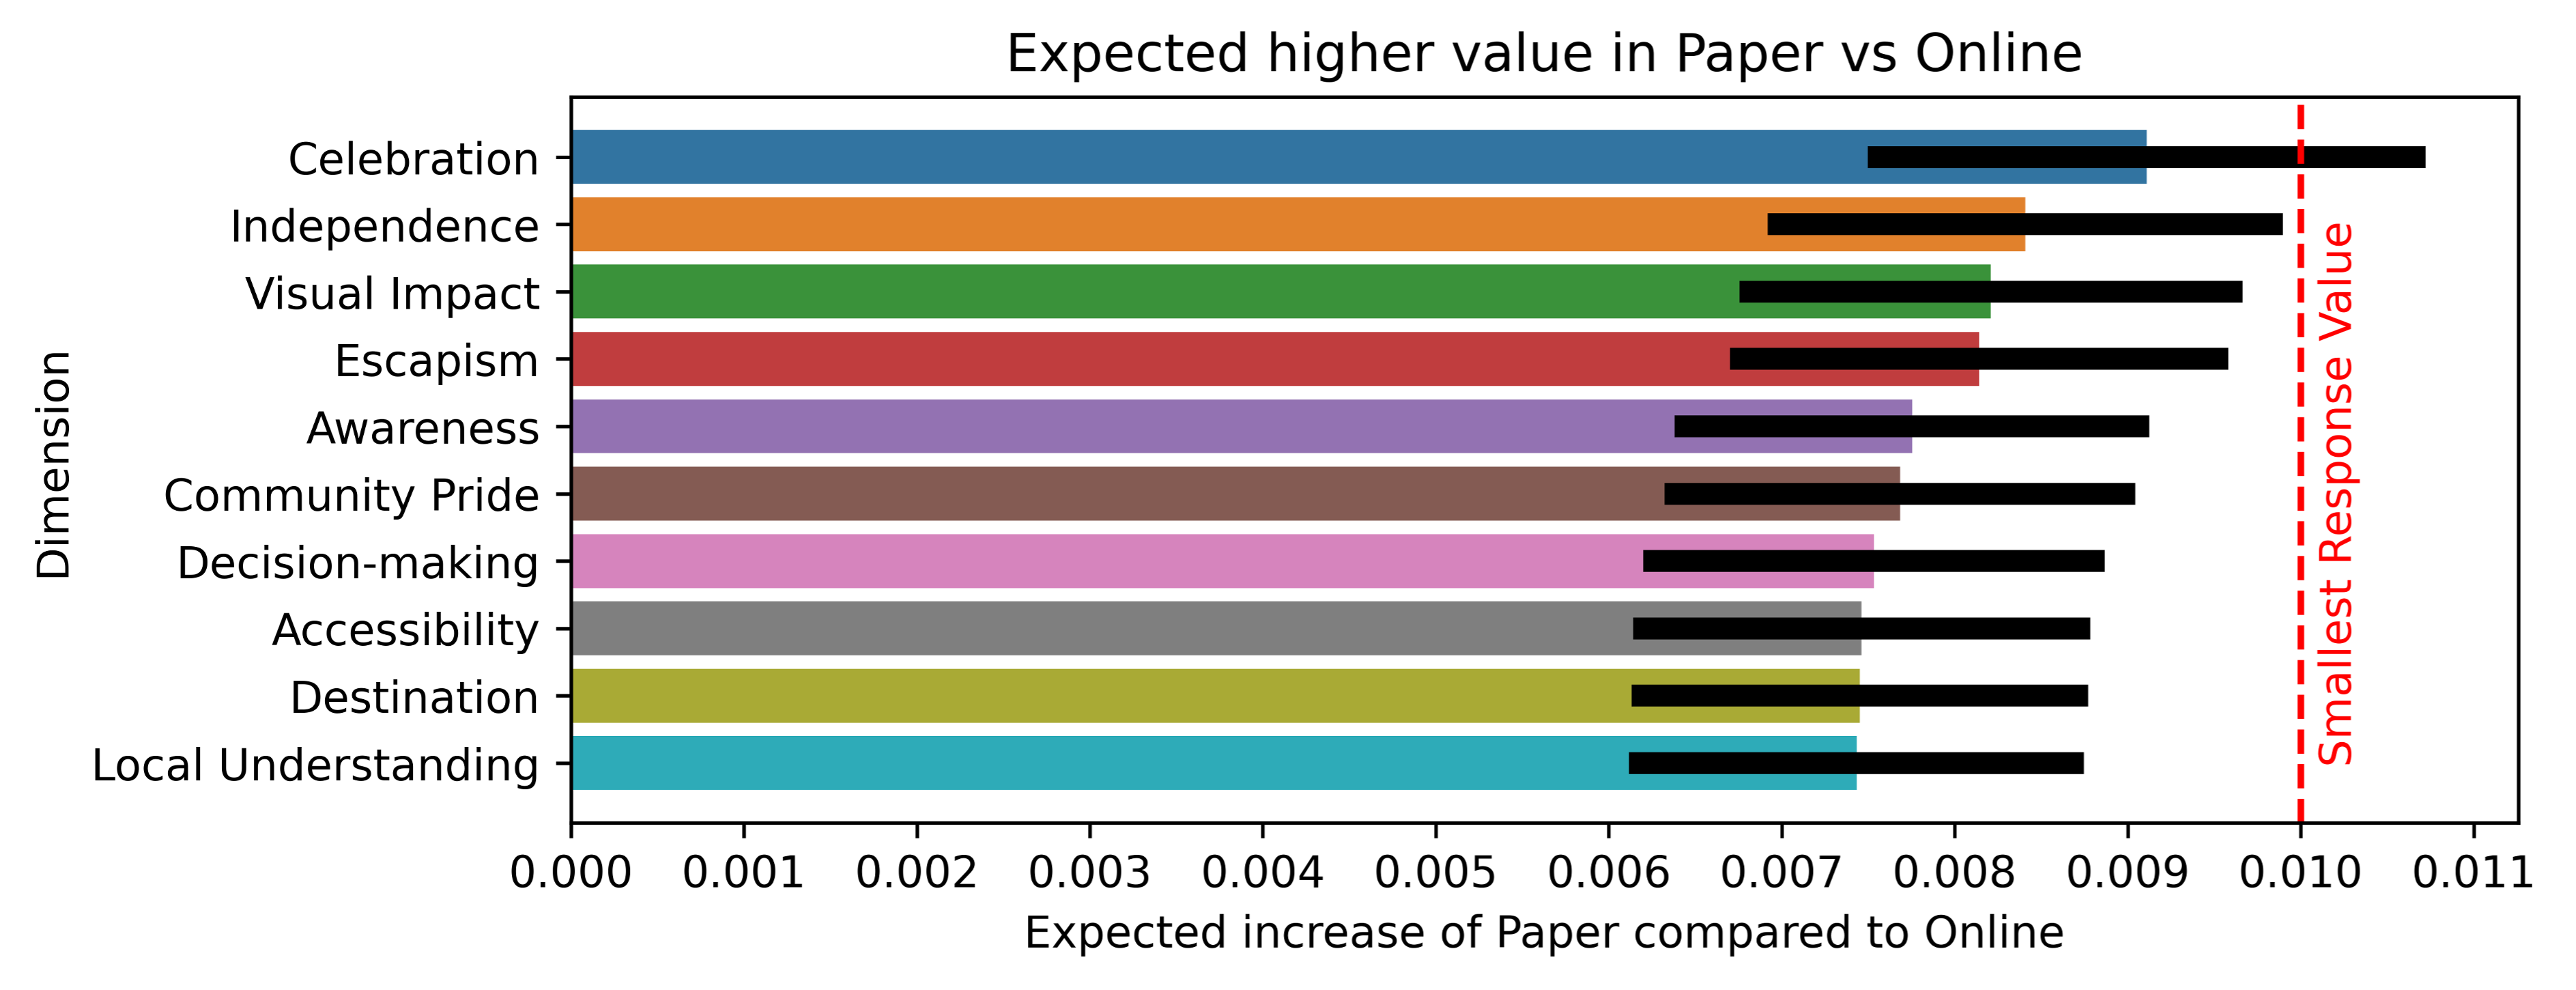 Figure 2 – Bar chart showing the expected increase of a dimension value if it were delivered as paper compared with online. Dimensions included in this figure are the highest expected difference out of all dimensions. The black bars indicate the 95% credible interval.
Conclusion
Our research demonstrates that although differences between delivery methods were statistically significant, and therefore do exist, the size of the differences were so small as to be negligible for our purposes.
Therefore, as a user of the Impact & Insight Toolkit, we have two takeaway insights for you:
- It is recommended that you choose the survey delivery method(s) that are most suited to your organisation and work. Your choice does not need to be swayed by considering consequences to your dimension results.
- It is appropriate for you to compare results to your dimension questions across your various evaluations and surveys. You do not need to exclude results from evaluations or surveys due to a different delivery method being used.
We confidently express the above two points because your dimension scores, shown as a figure to two decimal places, will not be impacted by your choice of delivery method.
Further Reading
An article that proposes a direct Bayesian alternative to the standard ‘T-test’
A video explanation by the same author of this method
An explanation of Classical vs Bayesian hypothesis testing
An example of Bayesian hypothesis testing
An article that explores Bayesian alternatives in biomedical research
An article that explores practical implications of Bayesian hypothesis testing
[1] If you would like support deciding which delivery method is most suitable for the work you’re evaluating, take a look at our handy flowchart.
[2] Read Culture Counts’ 2019 blogpost, ‘Are online surveys representative of my entire audience?’ for more detail.
Featured image credit – Rodion Kutsaiev on Unsplash