This case study focusses on analysis of evaluations conducted by Queen’s Theatre Hornchurch (QTH) and a subsequent meeting between Counting What Counts (CWC) and QTH. Many thanks to Mathew Russell and Julia Jones at QTH for working with us!
For more information on the background of the development of this case study, please see our blogpost ‘Working with a Data Analyst‘.
About Queen’s Theatre Hornchurch
Queen’s Theatre Hornchurch (QTH) is a vibrant producing theatre, working in Outer East London, Essex and beyond. As a cultural hub, over 210,000 people enjoy the programme each year. Audiences are guaranteed a warm welcome from a three-year winner of UK Theatre’s Most Welcoming Theatre (2016 – 2018) and London Theatre of the Year 2020 (The Stage Awards), the first Outer London theatre to receive this prestigious award.
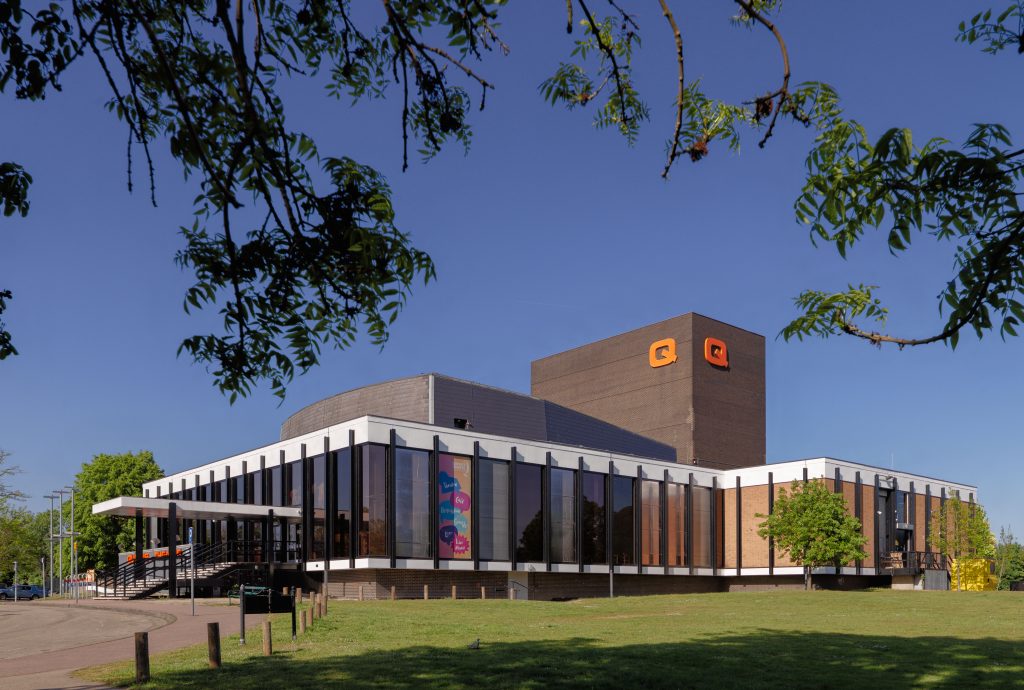
Queen’s Theatre Hornchurch
Our approach to the case study
QTH has been an active user of the Impact & Insight Toolkit (Toolkit) since the beginning of the project and has consistently evaluated and submitted their works over and above the mandatory requirements. This means there were a lot of evaluations to work with for a case study!
We began by grouping together all evaluations that QTH had carried out, analysing them as a group, and contextualising the evaluation results by comparing to those from similar organisations. We created two reports through our analyses which were then shared with QTH.
These reports were:
- The ‘Three words report’. This report utilised data from the commonly used question asking survey respondents to describe their experience in three words.
- The ‘Alignment report’. This report considers the alignment between ‘self-assessors’, ‘peer reviewers’ and ‘public’ dimension scores.
QTH tabled the reports at one of their quarterly board meetings for discussion. They gave us the feedback from this meeting and requested that we meet with members of their board and senior management team to help them to access the full value of the reports. This meeting took place in January 2022 and both organisations (CWC and QTH) learned a lot from the process which we will share and explain in this case study, under the heading ‘Face-to-face meeting’.
The content of the case study is divided into two sections:
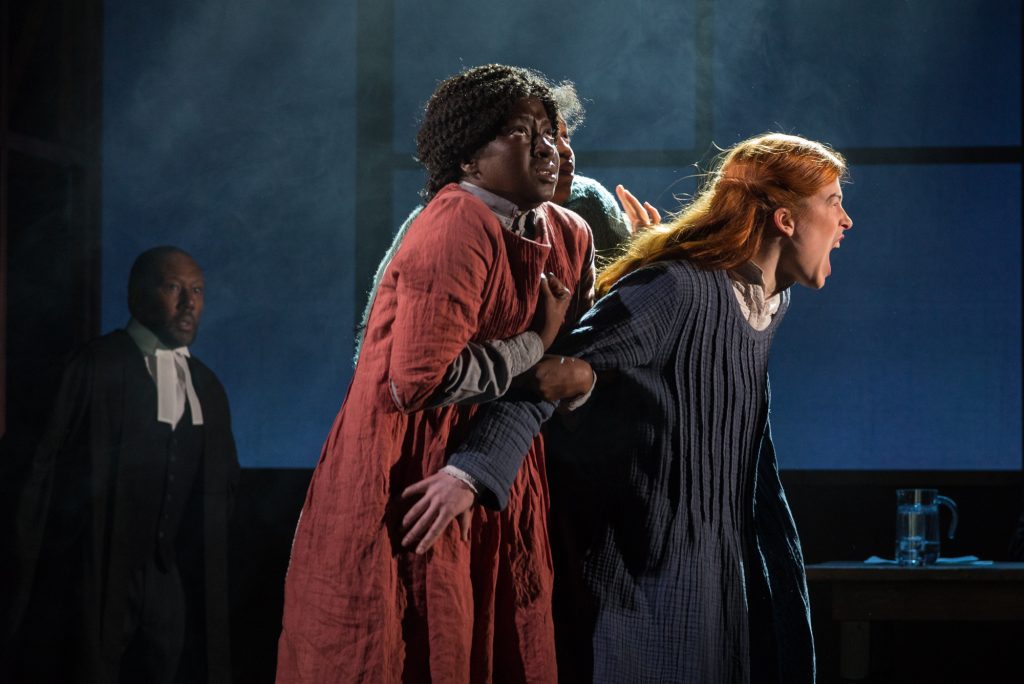
Image credit: Alessia Chinazzo
1. Queen’s Theatre Hornchurch Q&A
How has Queen’s Theatre Hornchurch been using the Toolkit so far?
We made a very conscious choice to go for it and to be an early adopter from the start. We didn’t want to see it as a requirement but rather an opportunity and, as a result, we’ve put a lot of energy into it.
One of the key things we did was determine that we would undertake the surveys for all our produced work, rather than just a selection. It seemed important that we weren’t just choosing the ‘crown jewels’ to evaluate. Instead, we thought we would get a much better sense of the Toolkit’s purpose if we evaluated over a broad range of our products.
More and more data from more evaluations would enable us to not only get a better sense of the trends, but also consistently engage the audience in that feedback loop. If that happens on a more regular occasion, it becomes part of the experience of the visit to Queen’s Theatre Hornchurch. This would make it more likely that people will engage with evaluation again in the future.
What have been the biggest benefits of using the Toolkit?
One of the biggest and most exciting things about it is the board engagement – that’s really interesting for us. There’s always lots of conversations about how you engage boards in talking about programming. To us, the Toolkit is quite a dispassionate tool in that regard: it’s factual, but in addition to information and facts, it’s also analysis from a range of different perspectives of looking at our product. Doing that through the form of the reporting of the Toolkit rather than your own reports is really interesting. It gives, not necessarily everything a Board needs, but it does give the right kind of context to discuss the work post event.
We’ve also managed to engage our staff. We approached it from the point of view of self-assessors not just being one or two people – self is all of the staff and the board. All the self- assessors are on the exact same level. With that, self becomes a body of response, which I think helps in terms of the validity of what we’re doing.
What have been the biggest challenges of using the Toolkit?
The challenges have been around peer reviewers and getting sufficient peer responses from a wide enough range of people to feel that those results have the same validity as the public and self categories. There’s a particular challenge for us because within our 1-million-person plus catchment area there are only seven National Portfolio Organisations (NPOs). So even though we’re in outer East London, getting peers to us is not always easy.
And then there’s a sense that there’s often a kind of “survey club” of people who always complete surveys and that these people are not typical of the full range of demographics of your audiences. The respondents are much older and perhaps more likely to be self-described as white or less likely to be to be D/deaf or disabled, etc., than the audience as a whole.
We’ve got there for self-assessment to an extent, but for peer and for public we really need to make sure that a wide range of representation is really strong.
Did the reports that we shared and the subsequent meeting increase your understanding of what the Toolkit is for and what can be done with it?
Most definitely. Both the reports and then the meeting just sparked an extraordinary array of interest and opportunity and excitement around the Toolkit and brought it to life in a really amazing way.
On the reports, the hunger for more is definitely there. Particularly the report around the three words analysis – that was just really fascinating. The fact that we were able to see that our intentions for that programming being reflected back to us by the audience in such a powerful way was extraordinary.
It indicated to us that sometimes you don’t really know what kind of impact programming is having on people. We rely on critics, staff, our board, friends, etc. You do get some feedback from the public, but to see it pulled together in that way and some of the words that were used to describe the ‘So Here We Are’ and the ‘Stiletto Beach’ programming was really wonderful.
Then out of the meeting there was an array of action and activity. Not just in what we can do but also the set of challenges that we put back to CWC in terms of things that we would like to be able to do in the future. If we were commissioning you, we probably commissioned a year’s worth of development work that we’d like to take place!
Are there any specific actions that have arisen as a result of our collaboration?
Well, I think there are lots actually:
We had a senior management team workshop to map our vision to the Toolkit dimensions, which was fascinating and incredibly useful. With the extra dimensions we chose around Local Impact, Enthusiasm and Escapism, there was an unlocking of the ability to use a consistent set of dimensions to evaluate a wider range of programming, particularly with more commercial music or comedy programming etc., that sometimes felt harder to apply some of the core dimensions. It also backed up how effective the core dimensions are most of the time. So often we would be trying to decide between 3 or 4 dimensions, only to arrive at the one that works best being a core dimension.
We are also now giving out iPads to members of the public after the shows to address the “survey club” challenge, trying to capture people which might not respond to email surveys, which has really started to shift the representativeness of our public survey results.
We’ve widened our definition of what a peer reviewer could be. We aren’t just talking about artistic directors of comparative size organisations but could have opened that up more broadly. As a result, we’re seeing significant increase in peer responses and, therefore, the validity of those results.
We had a session today where we talked about the timing of surveys and moving to a daily survey so the survey goes out immediately rather than putting in a batch every week or a batch at the end of the show. With this we’re again trying to capture more people more quickly with our surveys.
Has that encouraged you to put more time and energy into engaging with the data?
It most certainly has.
We’ve started to look at the benchmarking more and considering how we can get the most value out of it. We’re also widening the types of work we evaluate – presented work, learning and participation work, events – and then thinking about how you continue to share and interpret the results, and getting feedback from and empowering people across the organisation through the data.
What further support do you think you’ll need to do that?
I think we are now running ahead – there are things we would like to be available to us in an automated fashion and with more and more flexibility through the platform.
We’d love the benchmarking to be able to automatically feed into our reports. At the moment, we’d have to write a covering paper that would sit on top of the report, which means it’s less likely to happen.
We had a board meeting last night, and what is great is the feedback we often hear at those meetings: that there’s so much data and so much analysis; you really understand your audience through the numbers. But then, there’s the question of how you turn that analysis into different forms of storytelling. How do you take something like the Impact & Insight Toolkit and the narrative that is within a board and the other staff involved, and share that with the rest of the organisation and with the public, the participants, and the community so that the circle widens all the time?
We keep thinking about whether we have the capacity to build some of the interpretation capacity ourselves. If we were a large organisation, it might be we could build more reporting templates ourselves.
There’s definitely a hunger for more to come from the Toolkit.
What is the one message you want to leave the readers with?
For any form of reporting, whatever the purpose, you do really need to think about it and invest energy into it to make sure you get a return on the investment. Having a dialogue internally, you’ll start to see more and more of a return on that investment into the future.
For us it was great because we started with that kind of attitude – that we didn’t see it as a negative thing. We’ve always been positive, and we’ve only got increasingly positive and excited about using the Toolkit.
It does seem that if an organisation can really make best use of the Toolkit and the development work around it, it can be the most powerful and extraordinary way of looking at the impact of what you do. It is probably at the heart of how you can really deliver against the Ambition and Quality investment principle of Arts Council England (ACE), and provides a really meaningful way of doing so.
Click here to return to the top of the page.
Image credit: Mark Sepple
2. Report detail and meeting outputs
Three words report
The request, ‘Please write three words to describe your experience’ is commonly used in Toolkit surveys. It is recommended to be used in surveys as it is non-directive and can give useful context with which to interpret quantitative results.
The simplest way of analysing the answers to the three words question is counting the frequency of each word used. However, when doing this, we see a proliferation of words like ‘interesting’ and ‘entertaining’, which don’t really tell us much about the specific experience of one work or exhibition in comparison to another.
We also find that, despite respondents being asked to give only three-word answers to this question, they often use it as an opportunity to give lengthier comments about their experiences. Whilst there is potentially a lot of useful insight in these comments, it is much harder to access this insight without a lot of manual work.
In this piece of analysis, we used machine learning techniques to first clean the answers to the question (removing filler words in longer comments) and then to calculate word importance for each word rather than frequency. A high word importance measure means that the word was used a lot for a particular evaluation but was not used as often or at all to describe other evaluations.
This was quite successful and returned some interesting results.
Stiletto Beach, which is described on QTH’s website as being “A funny, heart-warming look at what it really means to be an Essex girl…”, had words like ‘empowering’, ‘feminist’ and ‘real’ showing as being very important for survey respondents. So Here We Are is a production which centred around male-friendships in a working-class Essex town. For this evaluation, words like ‘authentic’, ‘bold’ and ‘real’ all had high importance. For both works, these important words were also supplemented by frequent words such as ‘funny’, ‘enjoyable’ and ‘entertaining’.
We found these results interesting, as they reflect back the creative intentions for the productions without having to explicitly ask the respondents whether they found it real or authentic, for example.
In addition to positive feedback and reflection of intention, the important words also served as a channel for some criticism. For some of the works analysed, important words were ‘foul language’ or ‘too much swearing’. These weren’t frequently used; however, their importance for some of the works indicates that some members of the audience for those works found the language offensive.
Figure 1. Important words from Stiletto Beach
Click here to return to the top of the page.
Alignment report
When we say ‘alignment’, we mean how similar are the answers of those who experienced the work – the peer reviewers, public, and self-assessor post event survey – to the expectations for the work as described by the self-assessor prior survey. We can think of it as the distance between intentions and experiences.
With this report we did two interesting things with the idea of alignment:
1) We grouped all dimensions together to give us an overall measure of alignment for each respondent group – one for self-assessors, one for peer reviewers and one for the public.
2) We used the aggregate dataset to contextualise the results by comparing the alignment for QTH evaluations to alignment from all submitted evaluations.
We can see the results of this analysis in the table below. A high percentage means the results for that respondent group were very similar to the intentions when compared to the cohort, whereas a low percentage means they weren’t similar to the intentions when compared to the cohort. We colour coded alignments over 75% green and below 25% orange.
| Evaluation Name |
Submitted Date |
Self Alignment |
Public Alignment |
Peer Alignment |
| As You Like It |
28 September 2019 |
38% |
74% |
94% |
| One Man Two Guvnors |
01 November 2019 |
35 % |
38% |
2% |
| The Beauty Queen of Leenane |
25 November 2019 |
50% |
82% |
84% |
| Robin Hood |
24 January 2020 |
30% |
17% |
66% |
| Sparky the Elf and The Secret Toyshop |
24 January 2020 |
87% |
85% |
63% |
| Macbeth |
30 March 2020 |
36% |
79% |
55% |
| Sharon ‘n’ Barry do Romeo and Juliet |
19 March 2021 |
98% |
98% |
38% |
| Neville’s Island |
26 July 2021 |
89% |
47% |
11% |
| Tales From The Thames |
26 July 2021 |
89% |
10% |
84% |
| Love Lettres |
27 August 2021 |
98% |
54% |
11% |
| So Here We Are |
31 August 2021 |
45% |
40% |
9% |
| Stiletto Beach |
31 August 2021 |
79% |
88% |
31% |
We found that there was often good alignment between the intentions and self-assessment; and intentions and public opinion (see the green boxes in the Self Alignment and Public Alignment columns). Alignment between the intentions and self-assessment was particularly good, with no evaluations having a low percentage. Furthermore, this improves over the 3 evaluation years included, indicating that the body of self-assessors became more attuned to the intentions over time.
A few evaluations have good alignment between the intentions and peer review, but there are more which do not (more orange boxes in the Peer Alignment column). Of the 3 respondent groups, peers are most frequently misaligned with the intentions, and least frequently well-aligned.
There’s no objectively good or bad result when looking at an alignment table like this; it’s information which must be considered alongside the other information channels available to the organisation.
In this case, it did prompt some interesting questions:
Are there commonalities in the types of programming which achieve either good alignment between intentions and peers OR public?
What might programming look like which achieves good alignment between intentions and peers AND public?
Would programming to achieve good alignment between intentions and peers AND public mean compromising on creative vision?
Click here to return to the top of the page.
Face-to-face meeting
After we shared the reports with QTH, they tabled them at one of their quarterly board meetings. We hadn’t suggested this step, but it was absolutely the right thing to do! After they had their meeting, they gave us their feedback and requested that we meet with members of their board and senior management team to help them to access the full value of the reports – which we did.
We had a very productive face-to-face meeting at their theatre in Hornchurch, with many of the senior staff and some Board members from QTH in attendance. Not only did we discuss the reports, but also a raft of topics relating to challenges that organisations face when using the Toolkit. We’ve taken what we learnt from this meeting and are sharing it more widely, with the key highlights below.
Vision Dimensions & Embedding the Toolkit
To provide more context which we thought might help with the interpretation of the Alignment Report, we created and shared a presentation which explained some new concepts.
The presentation explained how selecting a set of dimensions which reflect your organisational vision, and then choosing from those vision dimensions for the works you are evaluating, provides background context which helps with the interpretation of the Insights Reports. If the board or senior management of the organisation do the work of selecting the vision dimensions, it also ensures they are bought into the Toolkit process in a way that surveys don’t achieve.
We felt that what we explained in the presentation helped plug some gaps in their understanding of how to make the most of the Toolkit. Because it was so well received, since then we have turned the presentation into a new piece of Toolkit guidance in the form of a short video which can be found here.
Figure 2. Process for embedding the Toolkit in your organisation
Definition of Peer Reviewers
Many organisations have trouble achieving many peer reviewers and QTH has been no exception to this, despite investing time and energy in solving the problem.
There is a common misconception that a peer reviewer must be a senior person from a similar sized organisation or an expert or critic in your specific domain. However, this isn’t the case. In our meeting we talked about how the category of peer reviewer can be much broader than just experts and critics.
As outlined in our guidance:
A peer reviewer is someone whose opinion you value – someone who you think can offer useful insight as well as a fair, informed critique of your work
This means you can open the category to people whose professional opinions you value, so long as they are not invested in the specific work that is being evaluated (i.e. they are unbiased).
QTH suggested the idea of asking those who are invited to an opening night to also be peer reviewers, where these people might be councillors and key members of the local community as well as people with a strong background in theatre. We think this is a great idea, and should ensure that a larger group of valid peers is achieved.
Click here to return to the top of the page.
Image credit: Mark Sepple
Thanks to Mathew and the team at Queen’s Theatre Hornchurch for their valued contribution!
Featured image: The Hired Man (small) – Photo Mark Sepple