Updated April 2025
This blogpost refers to the original Impact & Insight Toolkit Reporting Dashboard which was launched in October 2023. This dashboard and associated reports were replaced by the Reporting Dashboard 2.0, released in December 2024. Please see the Reporting Dashboard 2.0! blogpost for more information.
This blogpost provides the background and additional information regarding the Reporting Dashboard. If you are looking for guidance on how to create the reports and interpret charts, please look at the associated ‘Using the Reporting Dashboard’ guidance.
Impact & Insight Toolkit Reporting Dashboard
When we kicked off the new version of the Toolkit in April 2023, our plan was to provide Activity Reports and Ambition Progress Reports to you via email every quarter. However, it has become clear that many organisations don’t follow the same quarterly schedule, many more than we expected!
So, whilst we appreciate that Arts Council England funded organisations already have many data-focussed tools to work with, we decided that enabling you to view and create reports yourselves was the best way to provide these reports to you. This means that you can create Ambition Progress Reports and Activity Reports ‘on-demand’, according to your organisation’s schedule and needs.
With that in mind, we’d like to introduce the Impact & Insight Toolkit Reporting Dashboard, which is built and provided by Counting What Counts. It has been built to support the Impact & Insight Toolkit project, focussing on the results received via dimension questions, and enabling you to customise and create reports yourselves when you need them.
Because it has been built specifically for the Impact & Insight Toolkit, it also means that we can update and improve it in ways that support the ACE-funded cohort specifically.
How do I access the Impact & Insight Toolkit Reporting Dashboard?
The Reporting Dashboard is hosted externally to Culture Counts.
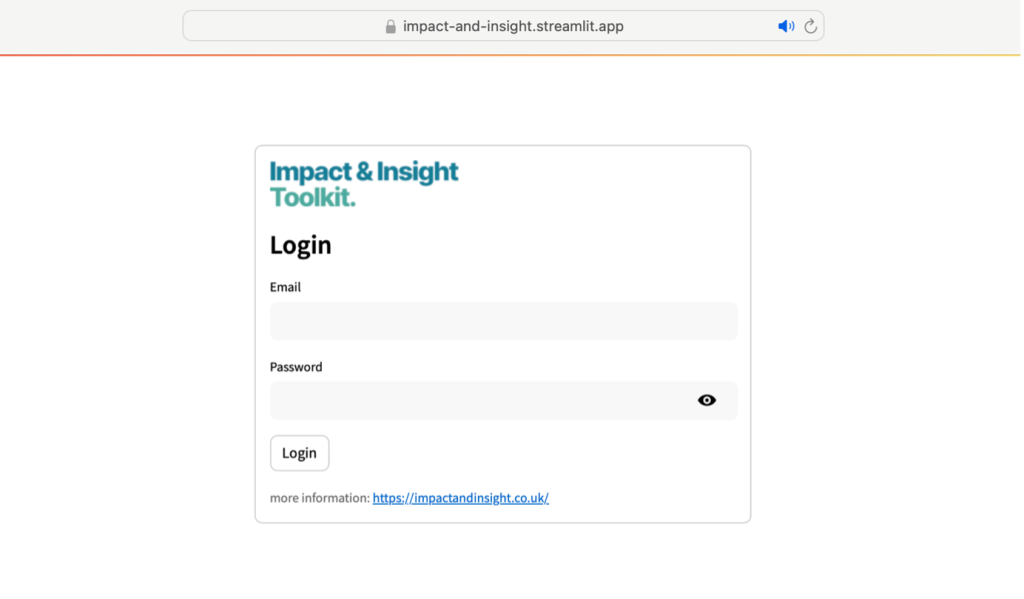
Click here to access the Reporting Dashboard.
You can log into the Reporting Dashboard by using your Culture Counts login details.

Who is it for?
Whether you are an Evaluation Assistant creating reports for someone else or the Chief Executive of an arts organisation who wants to be more data driven, so long as you are registered to use the Toolkit and have used dimension questions in your evaluations, the dashboard is intended for you. This includes anyone that:
- Needs to create quality evaluation reports for their board or management
- Doesn’t have the resource in-house to do their own data analysis
- Wants to learn from the data that they are collecting with the Toolkit
- Wants to compare the feedback from different projects that have been evaluated
- Is interested in benchmarking their evaluation results
What do I do with the reports?
Once you have used the Reporting Dashboard to create reports, it is up to you how you use them. There are two report types that can be created – Activity Reports; Ambition Progress Reports.
Activity Reports
You can assess the coverage of your evaluation activity and what dimensions you are measuring with your surveys.
Ambition Progress Reports
You can consider whether (or to what extent) your organisation’s ambitions are being reflected in the work you deliver, via the responses from your public, and use feedback from self-assessors and peer reviewers to be informed about potential ways to improve.
We would encourage you to share both the reports with your board by including them in board papers and allowing time to discuss them. This ensures that the contents of the reports are visible to both your board and your Relationship Manager at Arts Council England.
Known Limitations
Benchmarking
For the time being, there is only one benchmark available for comparison which is used for all organisations. This benchmark comes from the entire aggregate dataset without being filtered by dates, artforms or organisations. We appreciate that organisation-specific benchmarks would be more useful, and we fully intend to provide richer benchmarks for comparison in future updates.
Smaller sample sizes
For evaluations which collect smaller sample sizes (less than 25) the analysis provided isn’t as powerful. We are aware of this and intend to provide analysis designed for smaller sample sizes in future updates.
Triangulation
The Ambition Progress Reports don’t currently make full use of the Toolkit approach and templates. For example, the dimension results of self assessors and peer reviewers are not reflected in the analysis, only their written feedback. Users can expect to see updates to the dashboard to make better use of the available data including self, peer and public triangulation and analysis of the three words question, ‘Please write three words to describe your experience’.
Important things to note
- The dashboard updates every day at 9pm UK time, so, between 9pm and 10pm, you will be unable to log in to the dashboard.
- If you have not collected any data within the selected date range, no tables or charts will load.
- The Reporting Dashboard and the two reports, Activity Reports and Ambition Progress Reports, are not replacing the pre-existing Insights Reports. They are additional reports.
Will it change?
The Reporting Dashboard will change over time with new and improving features. If you would like to suggest improvements to the dashboard, please contact our support team at [email protected].
Photo by Joshua Sortino on Unsplash