In this blogpost, we’ll explore the importance of adding properties to your evaluations, how they enhance your data analysis, and how they contribute to answering key research questions in the arts and cultural sector.
Through the addition of properties, you can start to answer questions like:
Are our audiences experiencing our work similarly to others from the same artform, or are we delivering something truly different?
How accurate are our dimension results of the complete audience’s perspectives, when not all audience members completed the survey?
Take a look at how you can get started with properties in the remainder of this blogpost.
What are properties?
Evaluation properties are the metadata or ‘tags’ that are associated with your evaluation and the data that sits within it. Metadata describes other data[1]. Properties provide context to help us understand the data you have collected, allowing for richer analysis of your results.
There are all sorts of properties that you can choose to give a more detailed description of your work, such as:
- Event type
- Artform
- Location
- Attendance
- Duration
- Descriptive keywords
How do I add them?
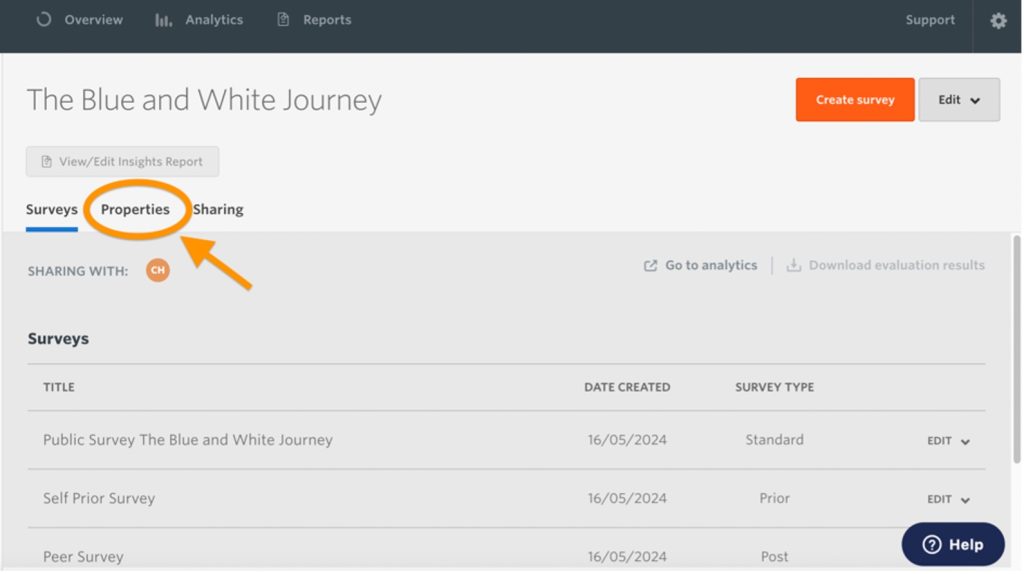
When you set up an evaluation in Culture Counts, you have the option to add Properties. From the main page of an evaluation in the platform dashboard, click on the ‘Properties’ button to start tagging your event.
You know your work inside out, so you are best placed to provide this added insight. It only takes a few minutes!
Watch this short video ‘Adding Evaluation Properties in Culture Counts’ to see how it’s done.
Why add properties?
Tagging your evaluation with properties only takes a few minutes, yet it can be the key to unlocking deeper insights that drive your decision-making.
Each property that you add feeds into the Benchmarking dataset, an anonymised aggregated collection of data that provides benchmarks against which your evaluation results can be compared. These benchmarks act as reference points or standards that help you understand where your work stands within the broader context of the arts and cultural sector, and also contribute to sector-wide insights. You can select the dimensions you wish to compare your data against in the Reporting Dashboard, or view the full dataset.
It is important to note that, for an evaluation’s data to be included in the benchmarks, it must be tagged with properties.
In short, the greater the detail of data, the richer the analysis of this data can be.
What can properties do?
| Property | What it does |
| Type | Describing the type of work enables us to provide artform-specific benchmarks for the dimensions. You could use these benchmarks as points against which you can compare your results with others in the dataset. If your work is a mixture of artforms it could be tagged as a festival, combined arts, media arts and carnival and public celebration. The more detail you can provide and the more context you can give to an evaluation, the richer the data analysis can be. |
| Location | Adding the location(s) of your work, including whether it was touring or online, enables us to learn how many of each type of work is being evaluated using the Toolkit. It can also then allow for more appropriate comparisons, considering geographical location(s) and touring status. |
| Attendance/audience figure | Knowing the attendance/audience figure of an event allows more accurate analysis of dimension results. This is particularly the case when considering the margin of error. It shows how close we think the average public scores is to the ‘true’ average score of all audience members or visitors who experienced the work. The lower the margin of error, the more likely it is that the result is reflective of the total audience. A margin of error of 2% means that if you were to survey your entire audience, the resulting score would likely be within 2% above or below the reported score.) |
| Duration | Having the duration of a work helps us to accurately report when a work takes place. It will also allow for comparisons to be drawn, considering things like seasons or days of the week. |
Utilising properties will allow your organisation to answer specific questions such as:
- Are our exhibitions’ results of chosen dimensions on a par with other exhibitions?
- How many other organisations are evaluating work featuring young artists?
- Does my organisation’s dimension selection differ to those of organisations that deliver similar works?
- With the knowledge of different artforms and the average results they receive, is my organisation being particularly ambitious in a certain area?
It will also allow you to answer some broader questions, such as:
- What is the most common event type that is being evaluated?
- Do dimension scores vary by the evaluated work’s subject matter?
- What are the most popular dimension choices for a specific artform?
- Do organisations with family audiences choose different dimensions to those with community and local audiences?
These questions can lead to pieces of research that not only inform the wider arts and cultural sector, but also help you answer key questions about your work that feeds into your organisation’s learning and development.
In summary…
Adding properties to your evaluations is a simple yet powerful way to enrich your data analysis, providing deeper insights into your work and its impact.
By utilising these properties, you not only enhance your understanding but also contribute valuable benchmarks that benefit the broader arts and cultural sector.
Start tagging your evaluations today and unlock the potential of your data!
If you have any questions about adding properties to your evaluations or comparing your data against the Toolkit dataset, please get in touch via [email protected].
Featured image credit – Photo by Angèle Kamp on Unsplash
[1] Volle, Adam. “metadata”. Encyclopedia Britannica, 28 Jun. 2024, https://www.britannica.com/technology/metadata. Accessed 13 August 2024.