The completion of surveys can be influenced by various factors, including: the order of questions, question type, and question choice.
Introduction
Working with many people that are new to quality evaluation, or are revisiting their quality evaluation strategy, we receive questions on both quality evaluation strategy and the practicalities of surveying. We recognise that we are in a unique position where we can address some of these questions using a data-led approach.
Something that those participating in the Toolkit project have queried is “Why do some respondents not finish my survey? Is it too long, too complicated…?”
While we cannot provide a fully comprehensive explanation for why people don’t complete surveys, we can analyse the data collected and offer guidance based on those insights.
This blogpost uses data collected in Culture Counts by users of the Impact & Insight Toolkit to provide you with some recommendations on how you might adapt your surveys to achieve maximum completed responses.
Summary
The Impact & Insight Toolkit takes an outcome-based approach to evaluation, focussing on the extent to which an artistic or cultural experience has led to a particular outcome. Organisations using the Toolkit are encouraged to carefully consider which questions to include in their surveys. As a result, the most valuable insights are obtained when a survey is completed in its entirety. Therefore, when a survey response is incomplete, you retrieve less valuable evidence regarding your aims and ambitions. But why do respondents not complete a survey?
A few years ago, our partners at Culture Counts had an in-house look at this and found that surveys with more questions:
- Took more time to complete
- Had slightly less proportion of the survey completed
- Did not affect the maximum number of questions answered (i.e. longer surveys still had questions near the end commonly answered)
However, we wanted to build upon this analysis through the inclusion of up-to-date data and the analysis of additional factors. We looked at all Culture Counts surveys and their responses collected between May 2015 and April 2024.
The highlights of our analysis are as follows:
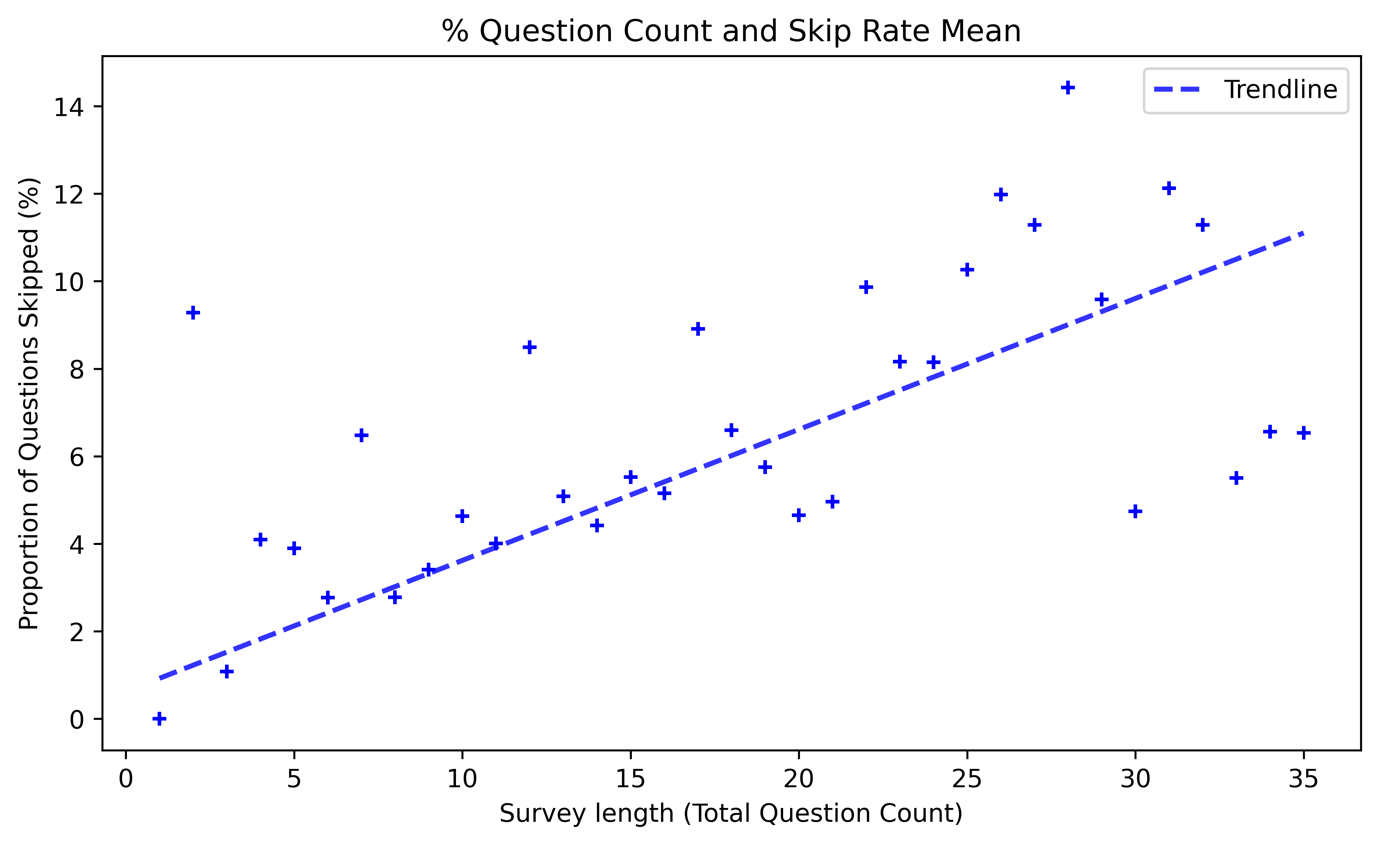
- Survey length had an impact on the proportion of a survey skipped. In other words, longer surveys had a greater proportion of questions skipped.
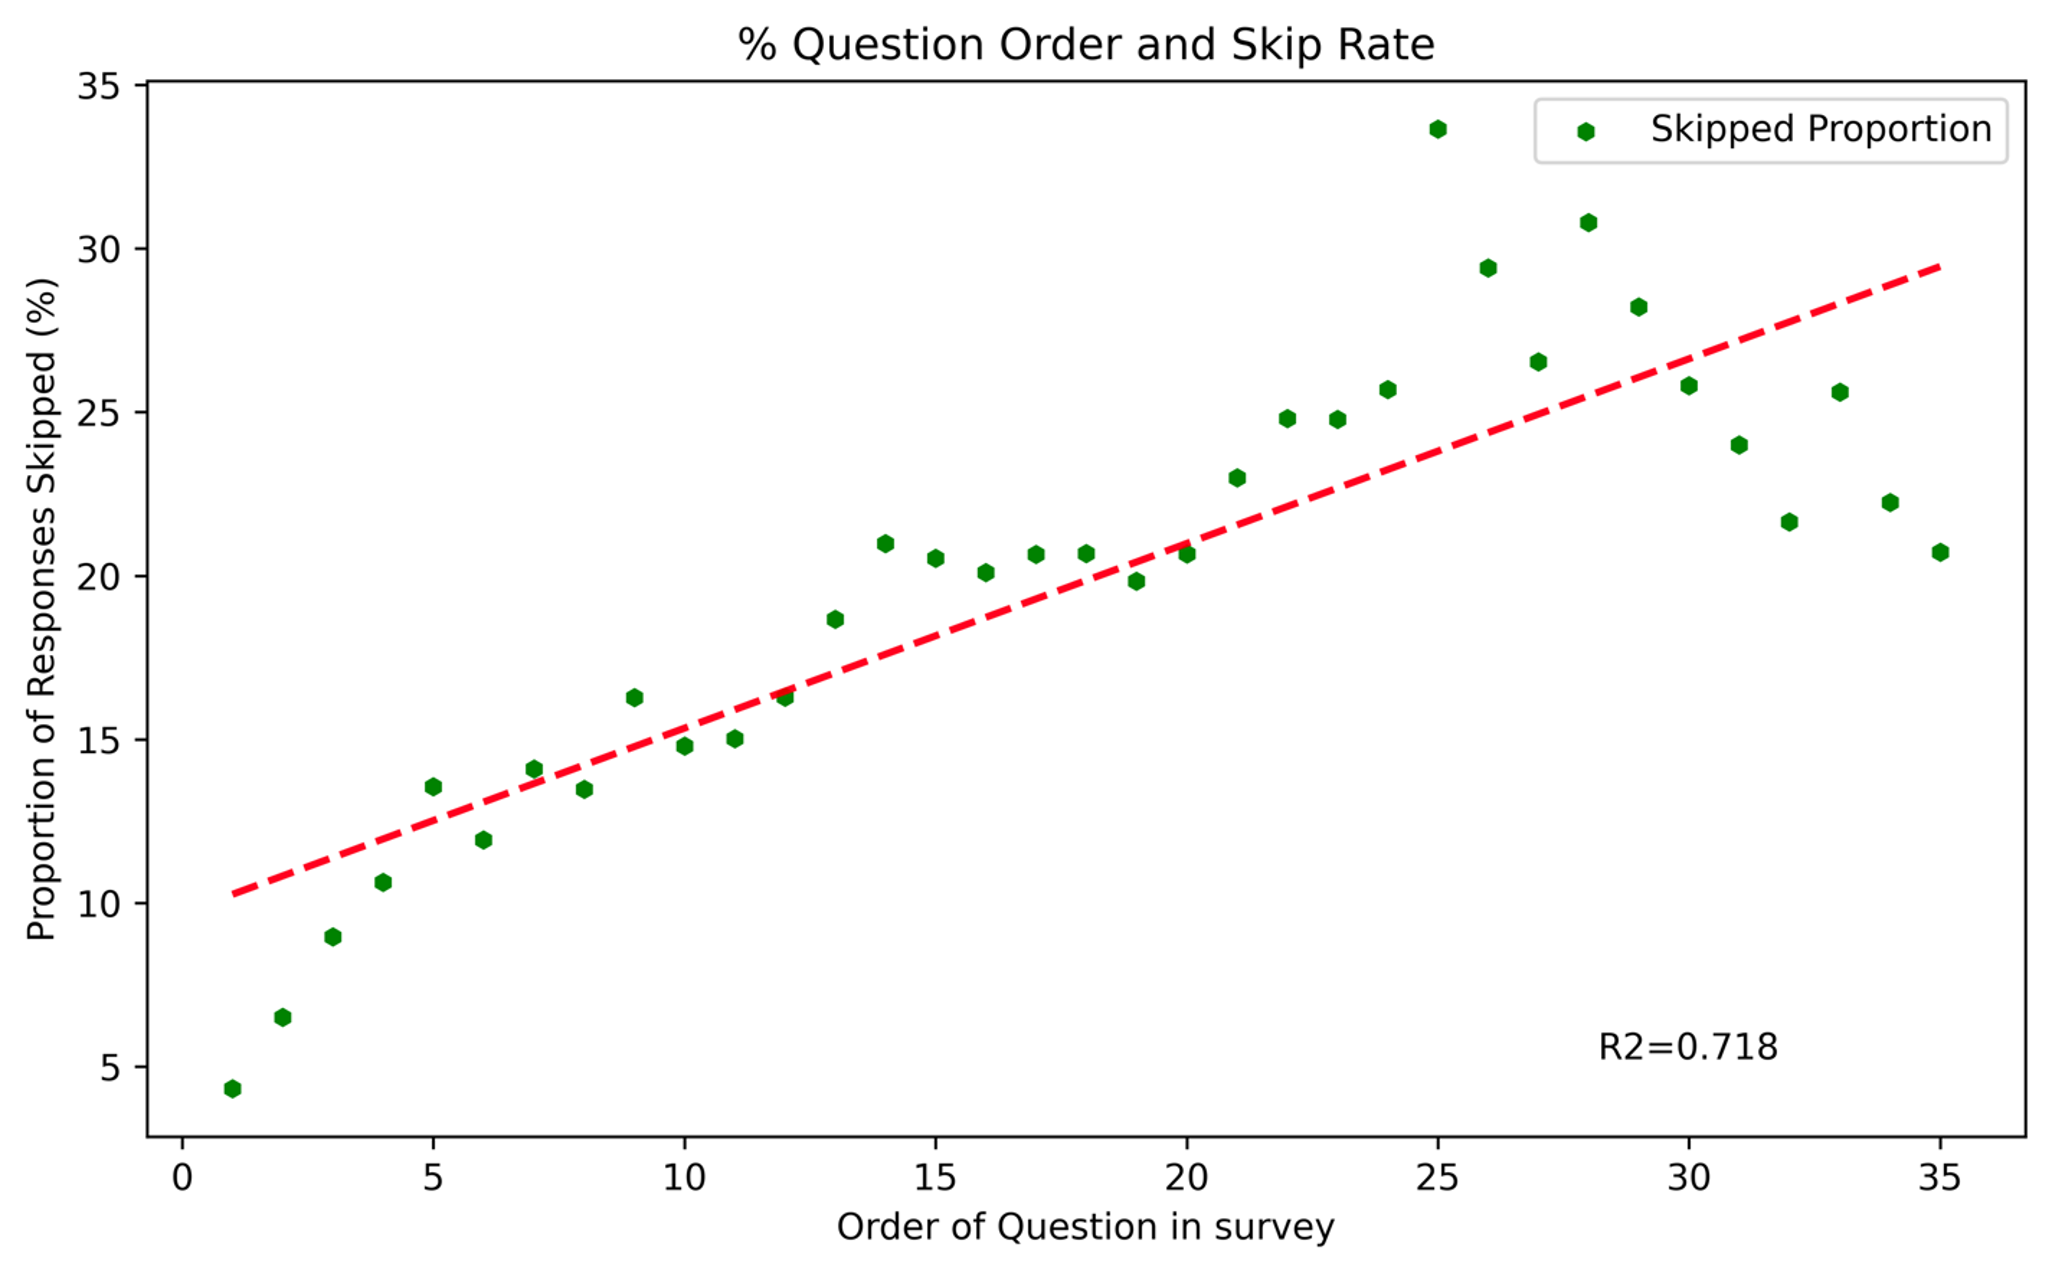
- The position of a question significantly affects its skip rate—questions placed later in a survey are more likely to be skipped.
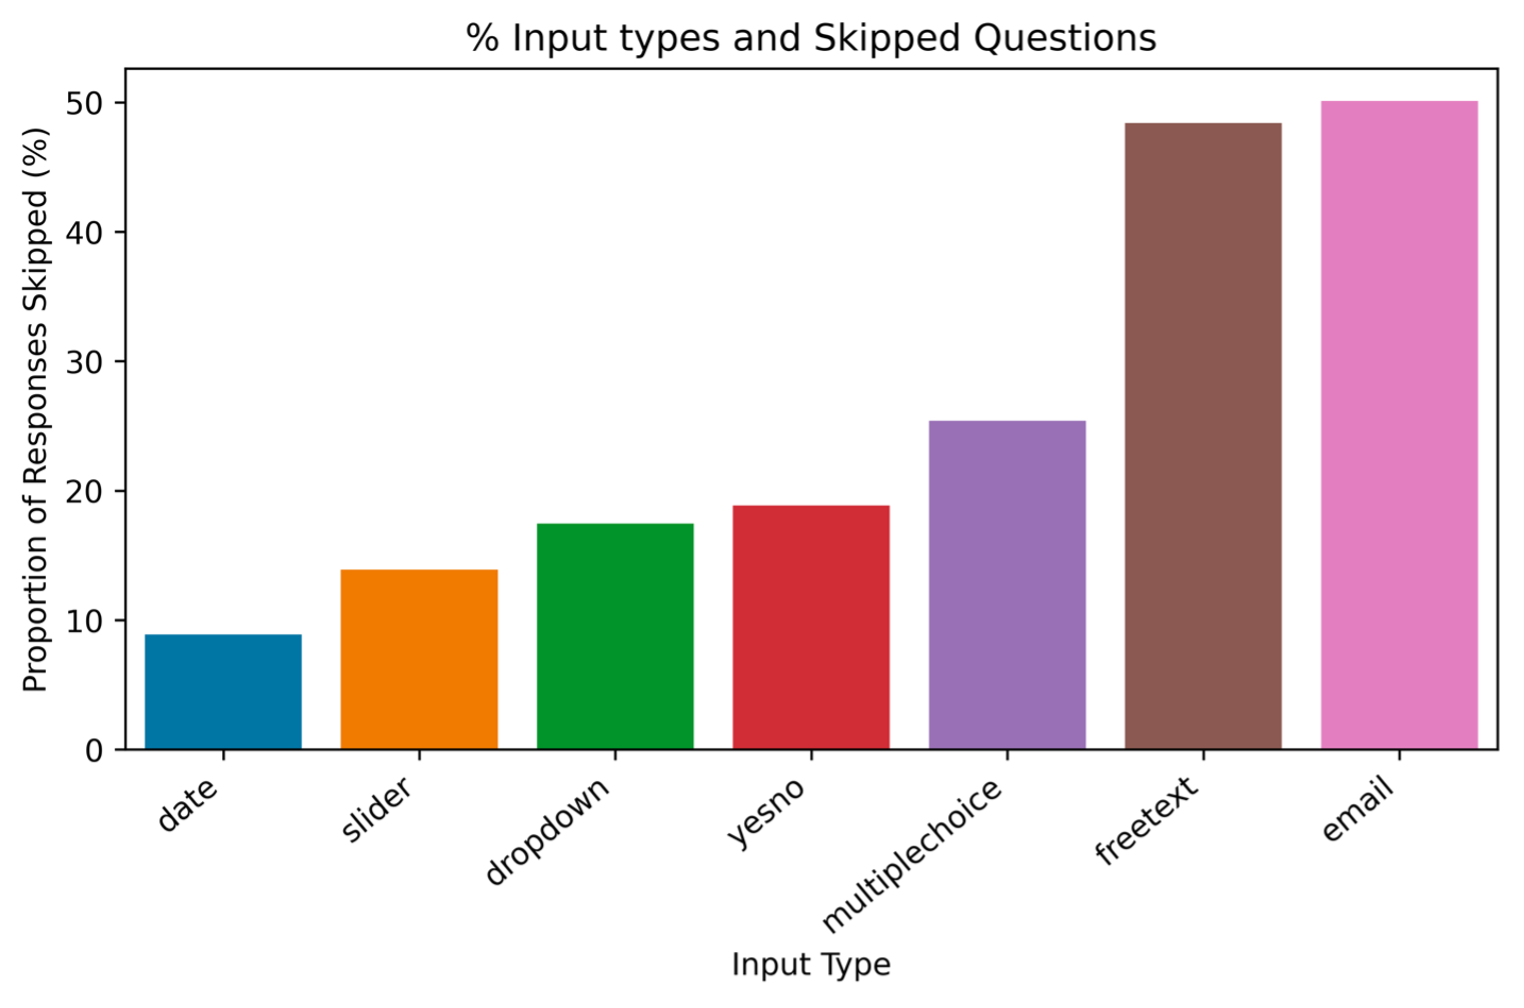
- ‘Date’ was the least skipped question type.
- ‘Dropdown’ questions were skipped less often than ‘multiple choice’ questions.
- ‘Email’ and ‘free text’ were the most skipped question types.
Bearing these highlights in mind, here are some recommendations for you when designing your surveys:
- ‘Free text’ questions should be used sparingly.
- Surveys should contain as few questions as possible, while containing sufficient questions for evaluation.
- Questions should be prioritised, with those of a higher priority appearing towards the beginning of a survey.
Continue reading for the analysis!
Question Types
Which question type is most likely to be skipped by survey respondents?
 Figure 1 Bar chart with the percentage of responses skipped given different question types
Since dimension questions, using the ‘slider’ question type, are a key component of the Toolkit approach, it’s encouraging that ‘slider’ is the second least skipped question type. Additionally, the fact that ‘sliders’ and ‘dimensions’ are typically not placed at the very beginning of surveys further highlights that this question type is well-received by respondents.

Survey Length
Proportion Skipped
Is there a maximum number of questions that can be asked before the proportion of survey skipped increases?
 Figure 1 Scatter graph comparing the number of questions in a survey, and the mean proportion of questions skipped (for every response, the % of skipped questions was calculated. Then, responses were grouped into length of corresponding survey, and an average taken of each survey length). Survey lengths with more responses and less variety of skip rates have more impact on the trend. This analysis only includes surveys with less than 36 questions (which contains 99.5% of all responses).
There is a visible trend between survey length and the proportion of survey skipped, demonstrating that longer surveys increase the proportion of survey skipped. It was found to be statistically significant when comparing groups of different survey lengths to each other (i.e. surveys 10-14 questions long were significantly different to surveys 25-29 long).
Drop-out Stage
If a respondent is to exit a survey part way through, at which point are they most likely to drop-out?
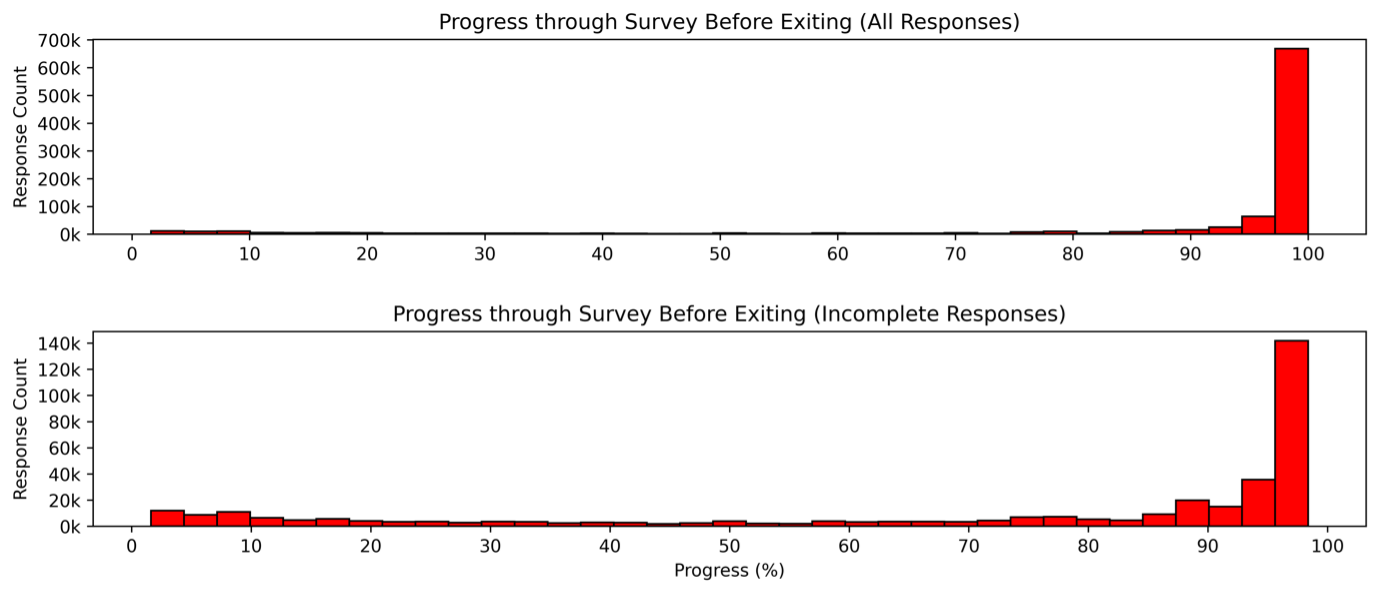
 Figure 1 Histograms showing the spread of responses and the % progress through a survey before dropping out- referring to the point in the survey where the respondent completed no further questions. Featuring fully completed survey responses (top) and incomplete survey responses (bottom). All survey lengths were balanced to the same number of responses. Note the different scale shown in the two y axes.
The most common stage of drop-out was over 90% of the total survey. When we exclude respondents that completed the entire survey, over 75% of respondents dropped out over 50% of the way through the survey. This knowledge indicates that it is wise to place higher-priority questions earlier in the survey.
Question Placement
Does whether a question is the first question seen by a respondent or the tenth have an impact on whether the respondent is likely to answer it?
 Figure 1 Scatter plot of the order at which a question is placed in a survey, and the proportion of responses that are skipped at each order. The analysis only includes surveys with less than 36 questions (which contains 99.5% of all responses).
There is a very strong relationship between the order at which a question is placed in the survey, and the proportion of responses skipped. On average, we can say that with every place a question is pushed back, the proportion of skipped responses for that question will increase by 0.5%.
Closing Comments
Our analysis has partially confirmed existing knowledge. ‘Free text’ and ‘email’ question types emerged as the most frequently skipped, likely because they demand more effort from respondents. Amongst the questions, those that were tagged as being from the Illuminate question set* had a notably high skip rate. ‘Slider’ questions were among the least skipped, primarily dimension questions.
The most common survey length was 8 questions, and a visible trend was found between the number of questions in a survey and the proportion of the survey skipped. The attempt to find an optimum number of questions for a survey was unsuccessful; there wasn’t a specific number of questions after which respondents exited the survey in a greater number than any other question. In fact, a significant portion of respondents reached the final question irrespective of survey length. Among those who didn’t complete the entire survey, over 75% of respondents completed over half the survey.
Therefore, the primary recommendation from this research is that users should have as short a survey as possible, with the most important questions positioned at the start of the survey.
If you need any assistance designing your surveys, please do not hesitate to contact the team at [email protected]
*The Illuminate question set focusses on demographic questions, but also includes those relating to audience make-up and behaviours. The Illuminate question set is publicly available and can be accessed via the Arts Council England website.
[1] See information on dimensions – https://impactandinsight.co.uk/demystifying-dimensions/
Featured image credit: Priscilla Du Preez 🇨🇦 on Unsplash