1. Introduction
The Impact & Insight Toolkit uses an online evaluation platform with three main survey delivery methods:
- Online delivery – A URL is generated which you email out to those that you wish to complete your survey; this requires email addresses and permission to contact.
- Interview delivery – A URL is generated, formatted for intercept interview delivery. Multiple responses can be taken on one device. Interview delivery can be used online or offline.
- Display delivery – A URL is generated; the survey is formatted similarly to the one for interview delivery, except that it is designed to be completed autonomously by the respondent.
We strongly encourage online or offline data collection wherever possible as:
- It is less resource-heavy than paper surveys – no need for manual data entry.
- Timestamp data is collected, meaning you can analyse your data to explore how views and experiences change over time.
- The data is of a higher validity.
However, there are occasions when you may need to collect data using a paper survey, such as:
- When you do not have access to the email addresses of attendees.
- When you have no portable devices (tablet computers, mobile phones) to collect offline or online data.
- When your audience is unlikely to respond well to the use of technology – perhaps due to age[1], disability or language difficulties.
- When the use of online methods does not feel appropriate given the setting, nature or content of the event you are evaluating.
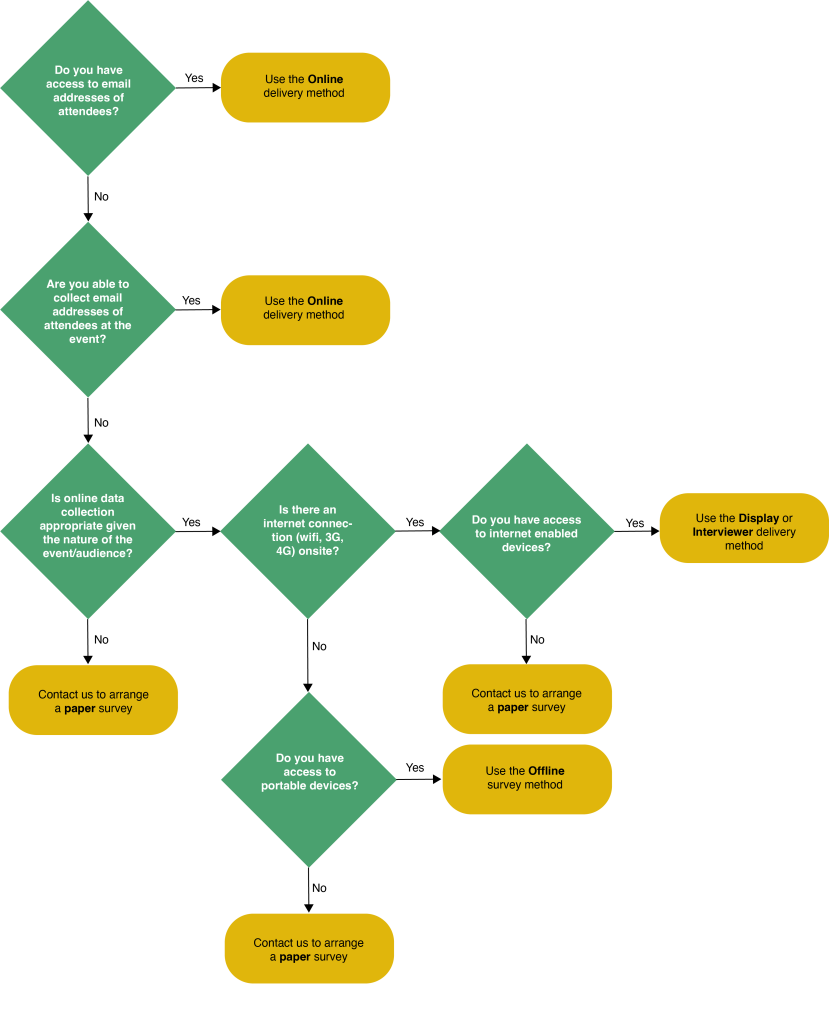
For any given event, the flow chart below will help you decide which delivery method(s) would be most suitable for the distribution of your public surveys.
2. How do I create a paper survey?
- Follow the steps for creating an evaluation in the Culture Counts platform, ensuring that the public survey is set up exactly how you want it.
- Use the ‘sharing’ tab to share your evaluation with a member of the Counting What Counts team. Please refer to the share evaluations section of our Platform Basics guide for more information.
- At least one week before the survey is required, contact us at Counting What Counts to request that we transpose your public survey. Please ensure that you tell us the name of the evaluation and survey that you would like us to transpose.
- We will transpose your survey, save it as a PDF and return it to you.
- Print out your paper surveys and distribute them at your event.
Even if you are using a paper survey to collect public data, you should still use the Culture Counts platform to set up and distribute surveys for self and peer assessors. Once your public data is uploaded into the system, you will be able to view and download graphs of self, peer and public data together. You will also be able to use the reporting template to produce a full report on your evaluation, and to download all the raw data in a CSV file for further analysis.
3. What do I do once I have finished collecting survey responses?
Interpreting your dimensions responses
When audiences respond to the dimension statements, they mark a spot on the scale to indicate their level of agreement. You may find that respondents vary in the way they indicate their level of agreement.
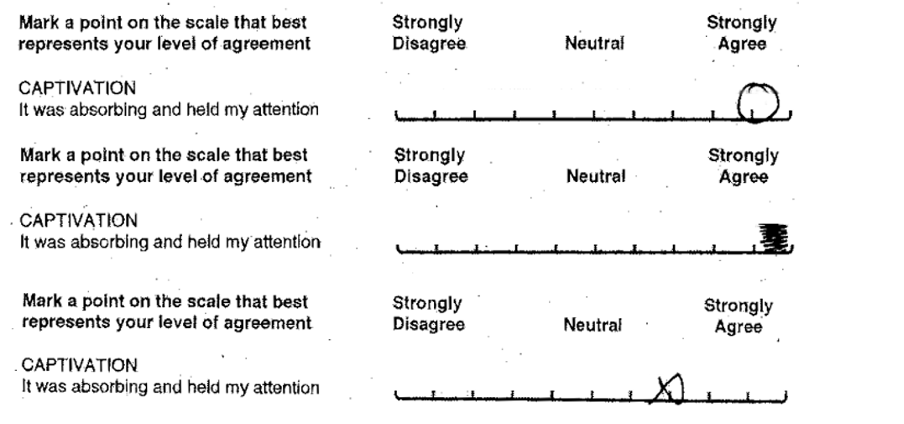
Like surveys on the Culture Counts platform, responses are given on a scale of 0 – 1. You will need to estimate the numerical value of each response, up to two decimal places. For instance, in the first example above, one would estimate the response to be 0.9. For the second response, one might estimate 0.95. If you are uncertain, we recommend rounding to the nearest half. We do not recommend that you spend a great deal of time trying to pinpoint the exact marking to two decimal places; in most cases the respondent will have tried to mark either on or in the middle of two lines.
In certain cases, respondents may mark their responses in a way that does not correspond with the scale and/or cannot be accurately interpreted to a valid numerical value. These responses cannot be interpreted or used, though their responses to other survey questions can still be kept and recorded.
A few examples of when it isn’t possible to accurately read the response:
1) In the event that a respondent writes ‘strongly agree’ instead of marking a point on the scale provided, one cannot accurately translate this into a number.
2) In the event that a respondent has indicated strong disagreement with the dimensions statements, but their free text responses indicate the opposite, it is likely that they misread the direction of the scale. We cannot make assumptions about what a respondent may have meant to write, therefore please do not record the response you think they intended to write.
Neither of these examples happen frequently but when they do, please know that you should not use these responses.
Uploading your responses to the Culture Counts platform
If you choose to use paper surveys, you are responsible for inputting and uploading the data yourself. To upload responses:
- Click on the ‘Summary’ page of the survey you want to import paper survey data to.
- Scroll down to the ‘Data Imports’ section and click ‘Download data template’
- Open the template in Excel.
- Use our Importing External Data guidance to help you input your paper survey response in the correct format.
- Click the ‘New data import’ button to upload the completed spreadsheet.
Please do not hesitate to get in touch with any questions.
According to Ofcom in 2017, 44% of those aged over 75 use the Internet; 53% of those aged 3-4 and 79% of those aged 5-7 use the Internet.