1. Introduction
This file contains guidance on implementing the recommended sentiment measurement framework in the Impact & Insight Toolkit – LE-PANAVA. It does not focus on the background of the framework or reviews of others. For that information, please see the relevant blogposts:
- Exploring ‘feelings’ prompted by arts and cultural experiences
- The uses and misuses of sentiment measurement for cultural experiences
- Considering frameworks and the selection of LE-PANAVA
2. What the LE-PANAVA framework measures
The framework is based around measuring positive affect (PA) and negative affect (NA). Positive affect refers to general positive emotion, not just happiness but also feelings of contentment, motivation or being relaxed. Similarly, negative affect refers to general negative emotions including sadness and anxiety. To round these out there is a measure of valence (VA), which can be summarised as a general good-ness of feeling.
With the LE-PANAVA scale, we have a small set of questions which capture positive and negative affect and valence and which are backed by valid scientific research. The framework includes five questions. Two for positive affect, two for negative affect, and one for valence:
| Type |
Low measure |
High measure |
| Positive |
Listless |
Full of energy |
| Positive |
Bored |
Enthusiastic |
| Negative |
Relaxed |
Angry |
| Negative |
Calm |
Nervous |
| Valence |
Unhappy |
Happy |
3. How does it measure them?
The LE-PANAVA framework is a concise set of five questions using accessible language which has been designed and tested for use on digital devices. These five questions can be included in a survey where the responses to the questions will indicate the level of positive and negative affect and valence for that individual.
4. How to use the framework
There are a few simple steps to using this framework.
Include all 5 questions in your survey
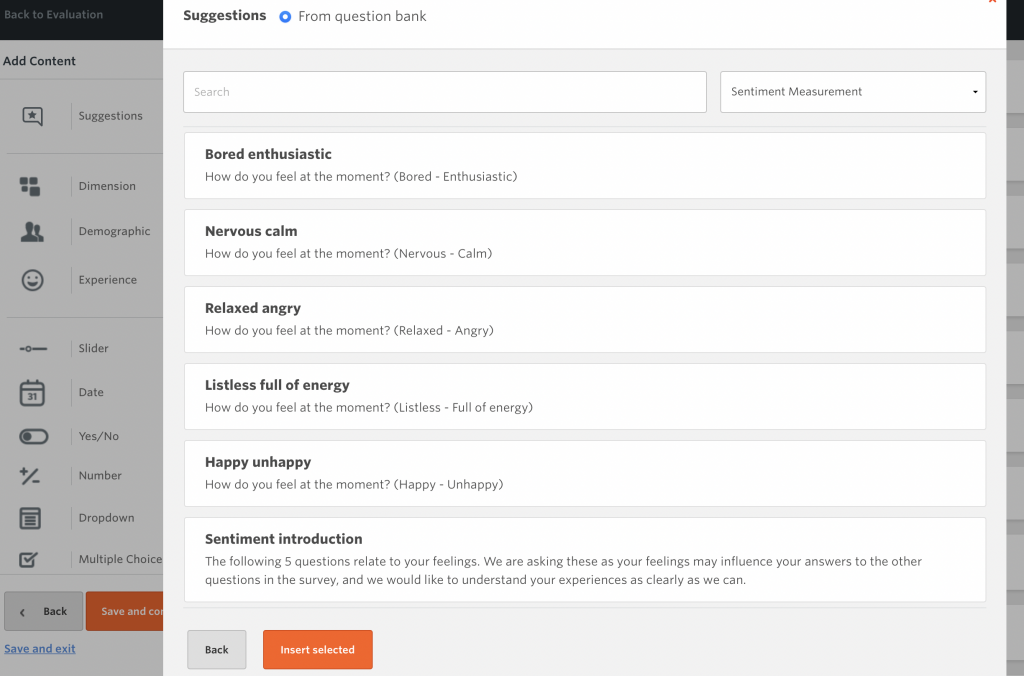
When designing your survey, it is important that all 5 questions are included together. To help with this, we have created a question bank containing a slider question for each of the 5 items that you will be able to drop into your surveys. The question bank also includes a short introductory message which must be kept inside the survey which explains our intention and sets the scene for the respondent.
The question bank can be found in the ‘Suggestions’ section of the ‘Design’ page of any survey.
Consider when your survey takes place
The questions will ask respondents how they are feeling in that particular moment. As such, when the survey takes place is important. You have two options which will achieve different things:
- In-person surveys immediately after the work takes place
- Online surveys sent afterwards via email
Both options will take a snapshot of the sentiment of those who you survey, and will enable you to explore how their sentiment is interacting with their answers to the dimensions questions (e.g., do enthusiastic respondents give higher levels of agreement to the dimensions?). However, if you want to get a sense for the way people are feeling when they experience your work, only surveying immediately after the work takes place will inform you of this.
Send out your survey
Once you have done the above, just send out your survey as normal! The data will be collected and included in your dashboard and insights reports alongside your other custom questions.
5. How to interpret the results
Automatic processing
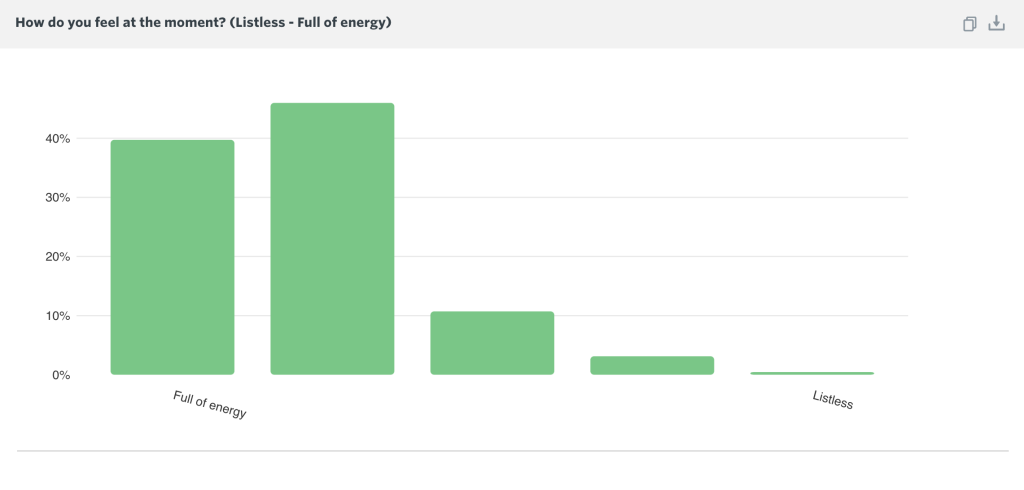
The data gathered through the Sentiment question bank will initially look like a dimension score i.e., each survey response will yield a decimal number between 0 and 1 for each of the questions.
This data will automatically be aggregated and displayed in your Culture Counts dashboard or in an Insights Report via a column chart (See the example below). Using this, you will be able to see the spread of responses for the different scales; for example, enthusiasm or happiness.
Manual processing
The measures can also be averaged to arrive at a single figure for positive affect, negative affect, and valence. This means that for each survey respondent you will have 3 numbers which describe their sentiment. This is a process that would have to be carried out manually in a programme such as Microsoft Excel, for example:
| Type |
Scale |
Answer |
Result |
| Positive |
Listless – Full of energy |
0.11 |
Average = (0.11 + 0.85) / 2 = 0.48 |
| Positive |
Bored – Enthusiastic |
0.85 |
| Negative |
Relaxed – Angry |
0.81 |
Average = (0.81 + 0.71 / 2 = 0.76 |
| Negative |
Calm – Nervous |
0.71 |
| Valence |
Unhappy – Happy |
0.48 |
0.48 |
What counts as high or low affect?
Having completed this extra aggregation step, we can benchmark the results against the table below:
| High |
Over 0/7 |
| Average |
0.3 to 0.7 |
| Low |
Below 0.3 |
6. What can the results tell us?
With this framework we can answer questions such as:
- What proportion of those experiencing our work have high/low sentiment?
- Do those with high/low sentiment respond to our work differently? We can do this by looking at how the dimensions results differ for people with high or low sentiment.
- Do we see consistent audience sentiment across multiple works, or do we see noticeably different audience sentiment depending on the type of work they experienced?
If you have any further questions about the use of sentiment questions, be it their inclusion in your survey or interpretation of results, please get in touch with us.