This final blogpost in our ‘Sentiment’ series will consider some examples of frameworks for mapping or measuring emotions, before introducing the framework that we have implemented in the platform and how to use it. The previous posts were:
- Exploring ‘feelings’ prompted by arts and cultural experiences
- The uses and misuses of sentiment measurement for cultural experience
Introduction
At Counting What Counts, we identified four frameworks that are widely employed within psychology and market research and which could be implemented in the Impact & Insight Toolkit (Toolkit). In our assessment of the different options, our priorities were that the measurement framework we choose is easily adaptable to the Toolkit format; and is concise, providing the Toolkit user with a useful snapshot of the emotional state of our audiences, without having to add too many additional questions to the surveys.
The frameworks we look at in this blogpost are Plutchik’s Wheel of Emotions and the Positive and Negative Affect Schedule (PANAS) Scale. These are two examples of frameworks which are very different and yet are both designed to describe the spectrum of emotions.
For our full assessment of the options, where they are explored in more detail, please see our ‘Sentiment Framework Research Report’.
Plutchik’s Model (Plutchik’s Wheel of Emotion)
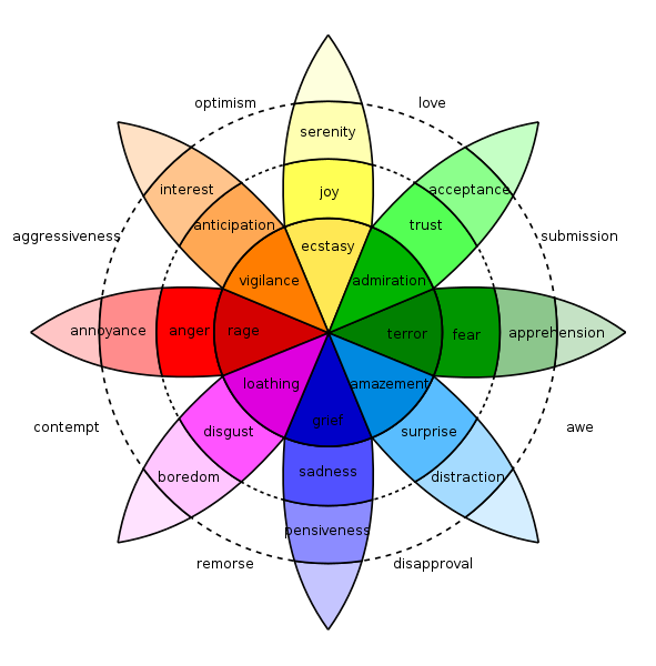
Plutchik’s Wheel of Emotions may sound like a fairground ride but is in fact a popular model for classifying emotional states. It identifies eight primary emotions: anger, anticipation, joy, trust, fear, surprise, sadness, disgust and anger. These primary emotions can be felt at different levels of intensity, represented on each spoke of the wheel. Each primary emotion has an opposite on the opposing side of the wheel e.g., ‘trust’ and ‘disgust’. Secondary emotions can be felt as a combination of two primary emotions, e.g., ‘joy’ and ‘anticipation’ forms optimism[1].
This model presents a complete framework of emotions that encompasses nuanced positive and negative emotion.
However, while this is a useful tool for thinking about and mapping emotions, using this for sentiment measurement within the Toolkit represents a challenge. The emotion classification would need to be adapted to the self-reporting survey format, creating questions that would look like dimension statements by converting the above emotional states into statements of affect, and then verifying that these questions accurately measure the emotions we want them to.
Another limitation here is the accessibility of language used within the framework. Different respondents may not easily be able to understand what the statement means and distinguish between these feelings.
PANAS Scale
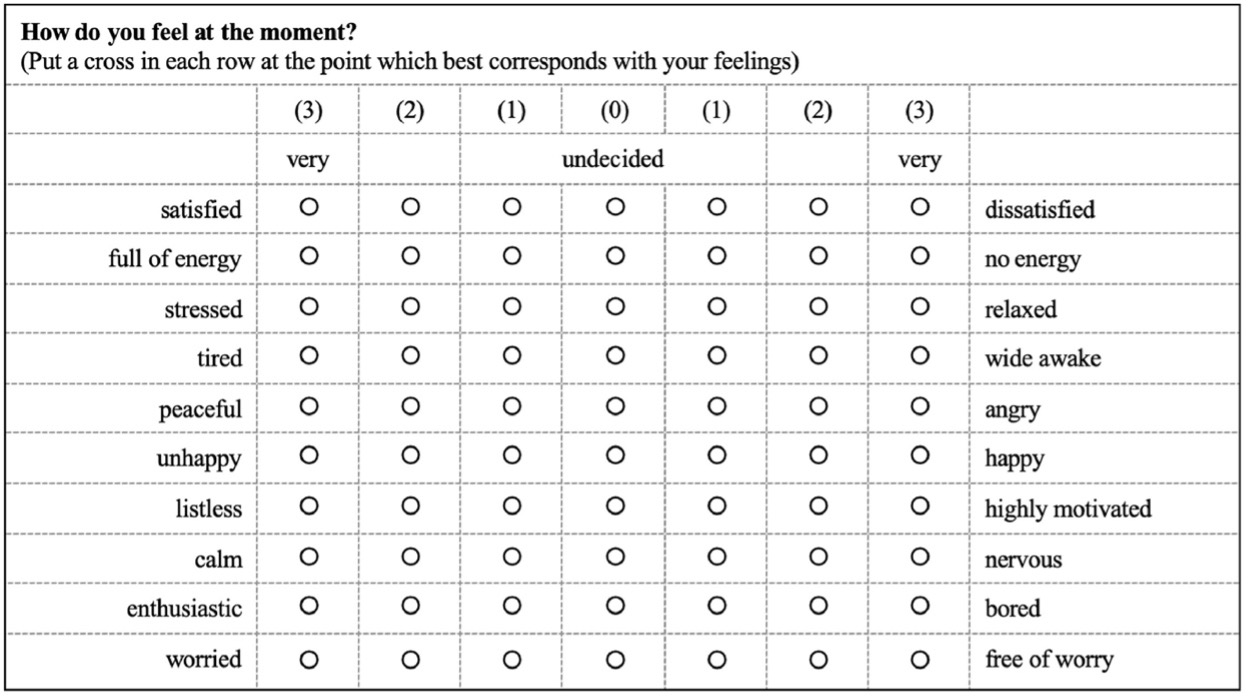
The Positive and Negative Affect Schedule (PANAS) Scale is a widely used self-report measure for capturing emotions[2]. The PANAS Scale consists of twenty words, ten negative and ten positive, which users self-report on a unipolar five-point scale. The gathered data is used to create a final score indicating levels of both positive and negative affect.
This initially presents itself as easily adaptable to the Toolkit because of the scalar nature of the survey which could be converted into slider questions. However, it is made up of twenty individual items which places a high response burden on the survey respondent and will likely result in survey fatigue.
The chosen measures
The Lebender Emoticon – Positive, Negative and Valence Affect (LE-PANAVA) Scale, developed by Marc Shreiber and Gregor Jenny in 2020, consolidates the PANAS Scale further into five items capturing positive emotion, negative emotion, and valence.[3]
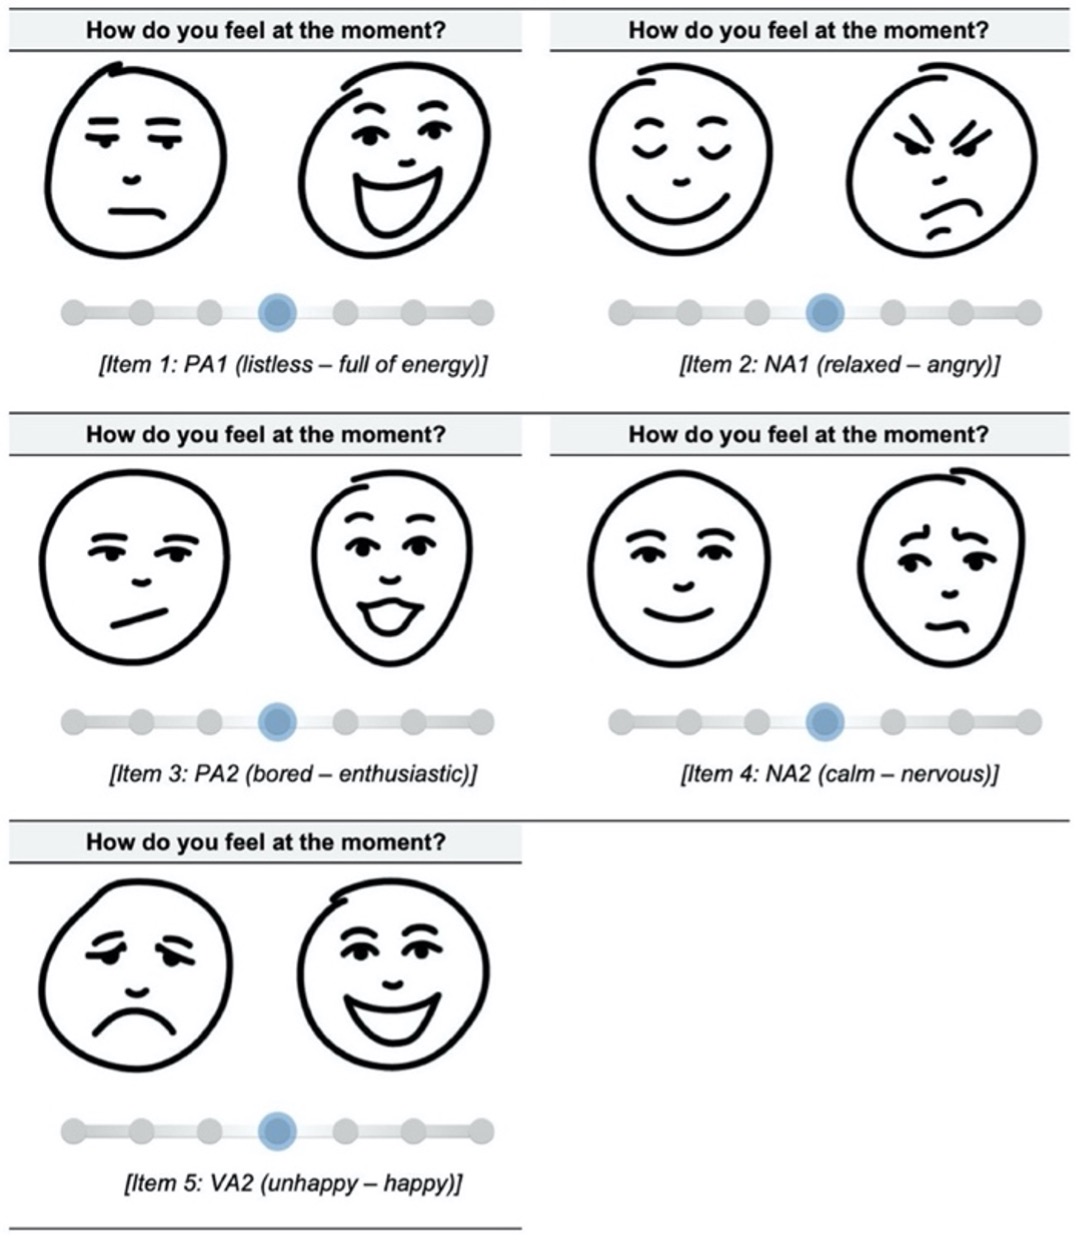
The benefit of the LE-PANAVA Scale is that it presents a concise five item subset of the PANAS Scale using accessible language and has been designed and tested for use on digital devices. Furthermore, it includes emoticon type images that have been validated for use with the scales. The benefit of using emoticons in this way is that they are intuitive, accessible and reduce the amount of time it takes for people to respond, reducing drop-off rates.
Due to its accessibility and concise nature, we have chosen to implement a version of the LE-PANAVA Scale within the Toolkit. For now, we will be using the ‘verbal’ questions which look like the rest of the Toolkit survey, but we do see the benefit of the emoticons. We will work with our partner Culture Counts to explore ways in which this might be implemented in future.
We believe these questions will give us all the most ‘bang for our buck’ in terms of measuring sentiment, giving us a useful snapshot of our respondents’ emotional state while only taking respondents an additional 25 seconds to answer within the survey.
How to use the framework
Now, as I’m sure everyone is eager to get going and test the waters of sentiment in our programmes, the final part of this blogpost will look at how to use the framework and interpret the data we are collecting.
Note: in our previous blogpost ‘The uses and misuses of sentiment measurement for cultural experiences’ we pointed out a few cautions and caveats before you start measuring sentiment, which we urge you to read to frame your interpretation.
Include all 5 questions in your survey
It is important that all 5 questions are included together, so we have created a question bank containing a slider question for each of the 5 items that you will be able to drop into your surveys. The question bank also includes a short introductory message which must be kept inside the survey, explaining our intention and sets the scene for the respondent.
Question banks are found under ‘Suggestions’ on the ‘Design’ page of your survey.
Consider when your survey takes place
The questions will ask respondents how they are feeling in that particular moment. As such, when the survey takes place is important. You have two options which will achieve different things:
- In-person surveys immediately after the work takes place
- Online surveys sent afterwards via email
Both options will take a snapshot of the sentiment of those who you survey, and will enable you to explore how their sentiment is interacting with their answers to the dimensions questions (e.g., do enthusiastic respondents give higher levels of agreement to the dimensions?). However, if you want to get a sense for the way people are feeling when they experience your work, only surveying immediately after the work takes place will inform you of this.
Interpret the results
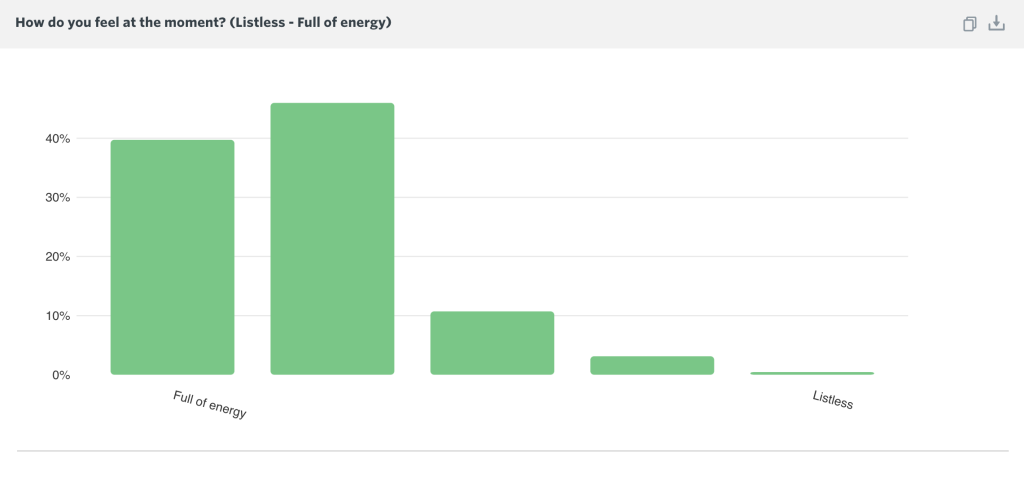
The data gathered through the Sentiment question bank will initially look like a dimension score i.e., each survey response will yield a decimal number between 0 and 1 for each of the questions.
Using this, you will be able to see individual or average scores for the different scales, for example enthusiasm or happiness. This data will also be automatically aggregated and displayed in your Culture Counts dashboard or in an Insights Report via a column chart.
There is an additional manual step which can be taken to use the framework in the way it was fully intended. This involves averaging the positive and negative affect measures to generate an overall score for Positive Affect, Negative Affect and Valence in your respondents. For more information, read our guidance document on including sentiment measurement in your surveys.
In aggregating these scores across the respondents, we will be able to get a general sense of the proportion of people surveyed experiencing positive or negative affect and, if used consistently, whether this varies over multiple works.
Using this data, we can see if people with a particular sentiment also report certain experiences. This will allow us to consider how emotions or feelings might influence the experiences of respondents, providing useful context to our survey results and important additional insight into our respondents and their experiences of your work.
This is the third blogpost in a series of three. Please see links below:
- Exploring ‘feelings’ prompted by arts and cultural experiences
- The uses and misuses of sentiment measurement for cultural experiences
- Considering frameworks and the selection of LE-PANAVA
Main image: Photo by Andrew Seaman on Unsplash
[1] Plutchik, R., (1991) The Emotions. United States: University Press of America.
[2] Watson, D., Clark, L. A., & Tellegen, A. (1988). Development and validation of brief measures of positive and negative affect: The PANAS scales. Journal of Personality and Social Psychology, 54(6), 1063–1070.
[3] Jenny, G. J., and Schreiber, M., (2020) ‘Development and Validation of the ‘Lebender Emoticon PANAVA’ Scale (LE-PANAVA) for Digitally Measuring Positive and Negative Activation, and Valence via Emoticons’, Personality and Individual Differences, Vol 160.